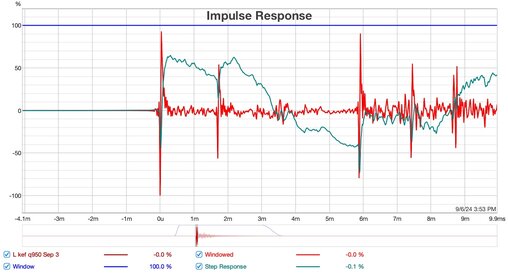
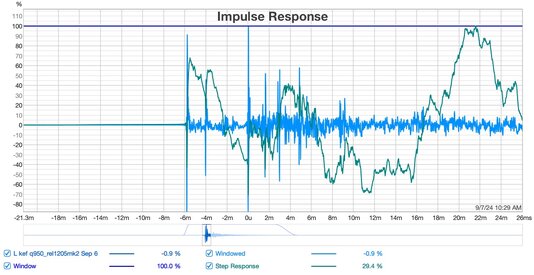
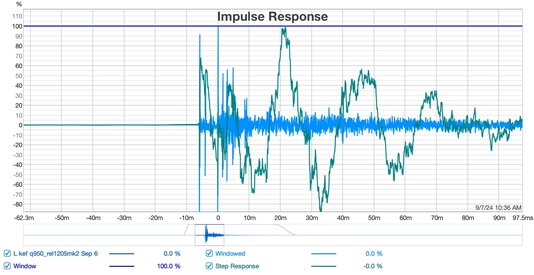
This isn't the same measurement I was referring to earlier since the step response here looks time-aligned, but it's alright. The same principles are relevant. Your frequency response shows a great deal of reflection energy from 300Hz up, which correlates to what we see in the following graphs.
Here I've marked all of the major problematic reflections and what the common culprit is for each of them, assuming that this measurement was taken from your main listening position and at ear height. If it was taken from somewhere else, this info won't hold up too well.
A. This is usually from a surface near the speaker somewhere. If the speaker is a floor-stander, the culprit is probably the floor. Bookshelf speakers usually don't have 2ms reflections if they are on taller stands. Typically these reflections show up if the speaker is on a desk or closer to the ground.
B. This reflection is almost as intense as your main pulse, which is a problem indeed. We want to see those reflections down around 10% or lower, not 90%. I'd say that this one here at 6ms is likely your ceiling. It could also be a side wall, but without the right speaker response to compare it to, it's not clear.
C-D. These could be anything from your side walls to your rear wall. Without the right speaker response, and without knowing your room's dimensions, it's difficult to tell.
E-F. These are from either your rear wall or one of the rear corners. Again, without the right speaker response, and without knowing your room's dimensions, it's difficult to tell.
G. Very likely a faraway surface like the rear wall or a rear corner. Once we get beyond 14ms it's almost certainly some distant surface somewhere. It would be interesting to see the other speaker response, and if it shows up there as well.
H. Unknown. 46ms is equivalent to around 49ft, which would mean that the surface is at least 24ft away.
The step response shows us the same information as the ETC but with emphasis on the lower frequencies. This is useful because the ETC is biased toward higher frequencies and doesn't really show the bass at all. I've marked where the ETC reflections are for reference, but there are other things to point out.
The first 20ms are critical to the step, but since I don't have the right speaker response I can't tell what the IACC (ICCC) looks like.
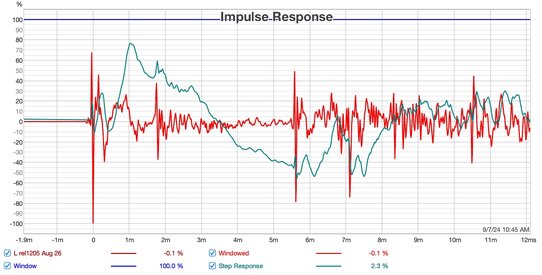
The step should gradually wind down, with the initial pulse and each successive crest being more intense than the next crest. You have a crest there at 27ms that's more powerful than the initial pulse, and the crest around 50ms is rivaling the pulse. Oscillation continues past 260ms. Ideally it should settle out between 100ms and 200ms. I have attached a screenshot below showing a more ideal step response and the frequency response that generates it.
Minimum phase step simulation:
Filtered frequency response simulation:
Note that the cleaned-up low end yields a more controlled step response. This is a minimum phase simulation based on a correction filter I made from your measurement. The real-world response will not look like that unless you implement some damping (absorption/diffusion) and get those reflections under control.


