Scale limits in impedance measurement

JLM1948

Member
Thread Starter
Joined
Jan 12, 2019
Posts
129
Hi,
I have finally got the time to set up impedance measurement. I intend to make a database of dynamic and ribbon microphone impedance.
I have used a 2kohm series resistor.
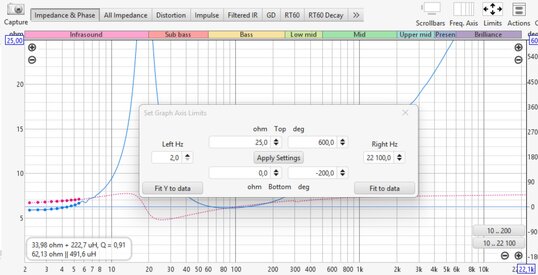
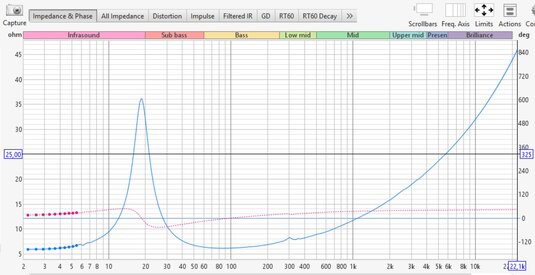
I find that the graph only goes to 1000 ohms.
Trying to change it in the "Limits" box apparently doesn't work.
Of course the cursor indicates the correct value, but I'd like to have the full graph.
Is it possible to have the impedance axis logarithmic instead of linear (which I know is a standard but doesn't make much sense IMO?
 

Midiman

Registered
Joined
Apr 1, 2024
Posts
7
I have a similar question. I was trying to measure the input impedance of a 1:1+1 audio line level transformer. I can see a curve at the left side and the cursor shows values between 5k and ~ 200 k but the scale of the Y axis only goes to 1000 ohm so I never actually see the curve.
Is there a way to change that or is REW limited to measuring impedances below 1000 ohm. If so, why?

It is a common use case in my audio lab to measure input impedances of different devices.
 

Midiman

Registered
Joined
Apr 1, 2024
Posts
7
Select log impedance axis in the graph controls.

I only have [Frequency axis log/linear] in the graph control. That selects log or linear X frequency axis but doesn't affect the Y axis. Am I missing something?
 

Bernard

Member
Joined
May 22, 2017
Posts
121
Select log impedance axis in the graph controls.

I only have [Frequency axis log/linear] in the graph control. That selects log or linear X frequency axis but doesn't affect the Y axis. Am I missing something?
Perhaps...
Click on the icon << Limits >> to the right of << Freq.axis >>, then click on << Fit Y to data >>.
 

Attachments

  • no scaling.jpg
    no scaling.jpg
    175.8 KB · Views: 8
  • Fit Y to data.jpg
    Fit Y to data.jpg
    212 KB · Views: 8

JLM1948

Member
Thread Starter
Joined
Jan 12, 2019
Posts
129
Select log impedance axis in the graph controls.

I only have [Frequency axis log/linear] in the graph control. That selects log or linear X frequency axis but doesn't affect the Y axis. Am I missing something?
It's at the bottom of the "Controls" tag.
Please note that measuring an otherwise unconnected transformer shows a much higher impedance than the nominal impedance. A typical 600 ohms transformer will show as a rising graph from about 1kohm at 20Hz to several hundred kilohms at 20kHz.
 

Midiman

Registered
Joined
Apr 1, 2024
Posts
7
Perhaps...
Click on the icon << Limits >> to the right of << Freq.axis >>, then click on << Fit Y to data >>.
Doesn't work. When measuring Impedance it goes max. 1000 Ohm on the Y axis. Also entering it manually doesn't work. It jumps back to '1000.'
 

Midiman

Registered
Joined
Apr 1, 2024
Posts
7
It's at the bottom of the "Controls" tag.
Please note that measuring an otherwise unconnected transformer shows a much higher impedance than the nominal impedance. A typical 600 ohms transformer will show as a rising graph from about 1kohm at 20Hz to several hundred kilohms at 20kHz.
Aaaaaaaah.... I found it! (It is in the 'Controls' submenu)
Ok.... that seems to work for my purpose.
And sure, I am aware of the impedance behaviour of transformers. Still, it is a kind of 'fingerprint' of the transformer and it might make sense to linearize that impedance with some components. It is about imagining, what a 'driver' will see.
 
Top Bottom