confused about Waterfall vs Spectrogram info

thothsong

Member
Thread Starter
Joined
Jun 29, 2021
Posts
405
Attached is a sub measurement. When I look at a Waterfall chart, it looks like 60 Hz goes on for more than 800 ms, for example:
49569


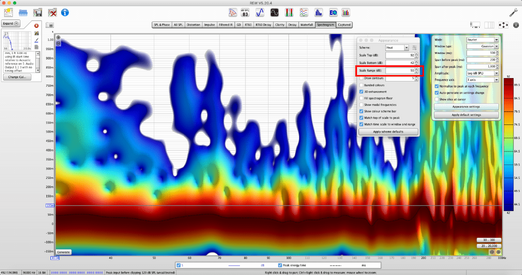
But when I look at a Spectrogram chart, it looks like 60 Hz stops in less than 300 ms:
49570


What's accounting for the difference, and which one should I pay attention to?
 

Attachments

Looks like it’s because the waterfall graph floor is 33 dB, while the spectrogram floor is 52 dB. T hus with the latter the display will fall off the graph “sooner.”

Regards,
Wayne
 
Hmm, how did those floors get set? I don't see any direct controls for them.
 
Look for the "Limits" icon.

Regards,
Wayne
 
For Waterfall Limits, I have SPL Bottom set to 41, not 33. The Spectrogram Limits have Top and Bottom in ms, not SPL.
 
Didn't know that, I've never used the spectrogram. Hopefully John will weigh in.

Regards,
Wayne
 
Waterfall limits (button labelled 'Limits', rectangle with four arrows inside) set to 100dB to 50dB (50dB span):

49572


Waterfall limits set to 100dB to 30dB (70dB span):

49573


Waterfall settings ('Gear' icon, labelled 'Controls'):

49577


Spectrogram limits (button labelled 'Limits', rectangle with four arrows inside) setting:

49574


Spectrogram settings ('Gear' icon, labelled 'Controls'):

49575


Spectrogram appearance settings (Gear icon labelled 'Controls', button labelled 'Appearance settings'):

49576
 
Your original settings. Waterfall set to 60dB range:

49580


Your original settings. Spectrogram with 40 dB Scale Range:

49578


Spectrogram with 50dB Scale range:

?hash=a419da8ad11e3348c3370713a2bc90e7.png


Spectrogram set with a 60dB scale range to match the Waterfall Scale Range:

49581


As @Wayne A. Pflughaupt correctly pointed out earlier, your confusion is arising from the fact that you have different scaling applied to the different charts. As you can see from the first Spectrogram plot above, a scale range that is too small and doesn't show enough info. The third plot has a scale range that is too large and shows mostly useless info about the background noise of the room. The second plot shows relevant info and removes that which you probably won't even hear. Remember that the microphone "hears" better than we do—at all frequencies.
 

Attachments

  • spectro50db.png
    spectro50db.png
    269.7 KB · Views: 18
Ah, OK, thanks, so what I was missing is that the Spectrogram SPL top and bottom settings are under Appearance, and should match the Waterfall SPL top and bottom settings to get equivalent results.
 
Back
Top