Loudspeaker step response looks unusual

paul8

New Member
Thread Starter
Joined
Nov 21, 2022
Messages
31
More  
Preamp, Processor or Receiver
Yamaha RX-A3080
Front Speakers
Jamo
Subwoofers
REL
I tested my KEF Q950 recently, and curios of why its step response looks so unusual, looks like after initial peak there's another one at 1.5 ms. What would cause this?
The attached picture is for L speaker, but R looks identical.
 

Attachments

  • kef_q950_step.jpg
    kef_q950_step.jpg
    148.3 KB · Views: 22

moedra

Member
Joined
Mar 1, 2021
Messages
130
It's likely that you are seeing the two separate spikes from the mid/tweeter and the woofers. The speakers probably are not time aligned. When you are looking at the step response, you generally want to be looking at the first 80ms of time. Your screenshot only shows the first 10 or so. The first 10ms are important, but you really need to see more of the response than this.
 

sm52

Member
Joined
Mar 14, 2019
Messages
992
It's likely that you are seeing the two separate spikes
Yes. It's as if two or more sound sources entered the measurement. Moreover, the first pair of peaks (0ms and 1.7ms) are similar to the second (5.9ms and 7.5ms).
 

paul8

New Member
Thread Starter
Joined
Nov 21, 2022
Messages
31
More  
Preamp, Processor or Receiver
Yamaha RX-A3080
Front Speakers
Jamo
Subwoofers
REL
I thought that second spike around 1.8 ms is from my sub, so I put my receiver into LFE only mode, and set the speaker crossover to full. I'm sending L signal only from REW so now the sub is out of picture. But the step response still looks same, the only thing I notice now is this double spike in impulse happens before the ref signal point. I wonder is this double spike impulse is the dither signal REW sends before the ref signal?
 

Attachments

  • kef_q950_step_fullrange.jpg
    kef_q950_step_fullrange.jpg
    184.8 KB · Views: 12
  • kef_q950_step_fullrange_100ms.jpg
    kef_q950_step_fullrange_100ms.jpg
    179.2 KB · Views: 11

paul8

New Member
Thread Starter
Joined
Nov 21, 2022
Messages
31
More  
Preamp, Processor or Receiver
Yamaha RX-A3080
Front Speakers
Jamo
Subwoofers
REL
This is step from another speaker of mine, looks more conventional to me:
 

Attachments

  • jamo_step.jpg
    jamo_step.jpg
    182.4 KB · Views: 13

sm52

Member
Joined
Mar 14, 2019
Messages
992
Not a single measurement looks ordinary. Try physically turning off all speakers except the one you are measuring.
 

moedra

Member
Joined
Mar 1, 2021
Messages
130
None of these images indicate that your speakers are time-aligned. For all I can tell, your speakers exhibit the behavior of those with passive crossovers in need of time alignment. Measure one speaker at a time without the sub, and let's see those responses.
 
Last edited:

paul8

New Member
Thread Starter
Joined
Nov 21, 2022
Messages
31
More  
Preamp, Processor or Receiver
Yamaha RX-A3080
Front Speakers
Jamo
Subwoofers
REL
None of these images indicate that your speakers are time-aligned. For all I can tell, your speakers exhibit the behavior of those with passive crossovers in need of time alignment. Measure one speaker at a time without the sub, and let's see those responses.
It is just 1 speaker, I'm only sending L signal, no sub involved. I also have similar measurement for R speaker, looks identical.
My guess is REW just picks up room reflections.
 

sam_adams

Member
Joined
May 23, 2017
Messages
306
It is just 1 speaker, I'm only sending L signal, no sub involved. I also have similar measurement for R speaker, looks identical.

Impulse peaks that are close in time—one to two ms—to the main peak at t=0, could be attributed to reflections from the mic or mic stand, furniture surfaces close by—the back of the chair or couch—or surfaces or objects that may be close to the speakers themselves. Peaks further away in time—5 ms or more—could be room boundaries or other objects in the room. The plots you posted also look like the measurements were probably taken without an acoustic timing reference. If you wish to accurately compare measurements between speakers, you need a common frame of reference in time. That's what the acoustic timing reference is for.
 

moedra

Member
Joined
Mar 1, 2021
Messages
130
It is just 1 speaker, I'm only sending L signal, no sub involved. I also have similar measurement for R speaker, looks identical.
My guess is REW just picks up room reflections.
I looked back at the last screenshot again and I'm still seeing the two drivers firing at different times, which is not time-aligned. This is due to the crossover in the speaker. Looking at the green step response here.. You should probably look at these graphs in the overlay window so you can see things more easily. Could you upload your mdat file for us to look at? I can show you what I'm talking about if I have the file handy.
 

paul8

New Member
Thread Starter
Joined
Nov 21, 2022
Messages
31
More  
Preamp, Processor or Receiver
Yamaha RX-A3080
Front Speakers
Jamo
Subwoofers
REL
I looked back at the last screenshot again and I'm still seeing the two drivers firing at different times, which is not time-aligned. This is due to the crossover in the speaker. Looking at the green step response here.. You should probably look at these graphs in the overlay window so you can see things more easily. Could you upload your mdat file for us to look at? I can show you what I'm talking about if I have the file handy.

Attaching mdat. I doubt that the crossover would cause this on brand new speakers.
 

Attachments

  • L kef q950_fr.mdat
    1.4 MB · Views: 10

moedra

Member
Joined
Mar 1, 2021
Messages
130
Attaching mdat. I doubt that the crossover would cause this on brand new speakers.
It's how passive crossovers work. Now, if you are bi-amping then the story changes. But if you have a single speaker cable connected and the crossover inside is handling the split, measurements will look similar to yours. I'll point out what I'm seeing for you...
 

sm52

Member
Joined
Mar 14, 2019
Messages
992

paul8,​

This measurement does not reflect reality. Because after the first response, the second one turns on, after 5.8ms. The second is superimposed on the first. Maybe the OS sound system does this, since the input and output are not selected (used by default), resends the same measurement sweep after 5.8ms. Or there are other circumstances. I don’t know if the Linux sound system has exclusive drivers like Windows (the name of the input or output begins with Excl), but it would be correct to specify these drivers in the sound card settings in REW.
 

paul8

New Member
Thread Starter
Joined
Nov 21, 2022
Messages
31
More  
Preamp, Processor or Receiver
Yamaha RX-A3080
Front Speakers
Jamo
Subwoofers
REL

paul8,​

This measurement does not reflect reality. Because after the first response, the second one turns on, after 5.8ms. The second is superimposed on the first. Maybe the OS sound system does this, since the input and output are not selected (used by default), resends the same measurement sweep after 5.8ms. Or there are other circumstances. I don’t know if the Linux sound system has exclusive drivers like Windows (the name of the input or output begins with Excl), but it would be correct to specify these drivers in the sound card settings in REW.
OS itself has no business re-sending anything, my version of Linux uses ALSA sound system, which is normally transparent to applications, input and output are selected in sound settings in the OS - output went over HDMI to my Denon receiver, input is my USB audio interface with XLR mic. I have similar measurement done on Mac as well - looks pretty much same.
 

Chris A

Member
Joined
May 22, 2017
Messages
66
Location
Arlington, Tx
More  
Preamp, Processor or Receiver
Emotiva XMC-1 AVP, Xilica XP-8080 & miniDSP 2x4 HD
Main Amp
First Watt F3, Crown D75-As (5 total) bi-amping
Additional Amp
Crown XTi-1000 for subwoofers (2)
DAC
Topping D10 Balanced (stereo only mode)
Universal / Blu-ray / CD Player
LG UBK90, Oppo BDP-103, Laptop
Front Speakers
Klipsch Jubilees (TAD TD-4002 compression drivers)
Center Channel Speaker
K-402-Multiple Entry Horn (full range)
Surround Speakers
Klipsch Belle bass bins with ESS AMT-1, bi-amped
Surround Back Speakers
-
Front Height Speakers
-
Subwoofers
DIY SPUD Tapped Horn (2) behind fronts
Rear Height Speakers
-
Screen
LG OLED 77"
Remote Control
Logitech Harmony One
Attaching mdat.
If you look at your "RT60" plot, you will see that your room is basically not damped at all, with reverberation times around 0.9 seconds. Those times should be down around 0.4 to 0.5 seconds, so you've got a real issue with too much reflections in-room. Also, if you're using microphone distance greater than 0.5 to 1m (and it looks like you might be), you need to place the microphone much closer to the loudspeaker front baffle.

Additionally, if you look at the spectrogram view, you will see strong reflections at 1.68ms, 3ms, 5ms, and 8.7 ms, corresponding to reflectors in-room at 0.58 m, 1m, 1.7m, and 3m distances (reflection path lengths greater than the direct arrivals to the microphone). It looks like you are getting strong reflections up to ~6 kHz (looking at your group delay plot). Basically everything up to that frequency is being heavily modified by in-room reflections (where you placed the microphone).

I'd recommend taking the loudspeaker out of that room and placing it carefully outside away from anything acoustically reflective, then take another measurement. I think you'll find dramatically different results.

Additionally, I'd temporarily add a great deal of absorption to your floor between the microphone and the loudspeaker, and anything else reflective--like side wall/front wall, electronics racks, and furniture. This can be foam rubber (like an old mattress topper), and thick quilts, fuzzy blankets, etc. that have wide-band absorption capabilities.

Chris
 

sm52

Member
Joined
Mar 14, 2019
Messages
992
output went over HDMI to my Denon receiver
Then there are two options. In Windows, many programs that work with sound can send their data to the default audio output device. The OS mixes all incoming streams and sends them to one output device. Therefore, if in REW you select an input and output whose name is Excl, all other sound sources except the selected ones will be disabled. I don't know how this process is organized in Linux.
The second case is how the receiver works. Maybe it turns off when there is no signal, and then turns on too late when the signal appears, and REW does not receive the correct data.
 

moedra

Member
Joined
Mar 1, 2021
Messages
130
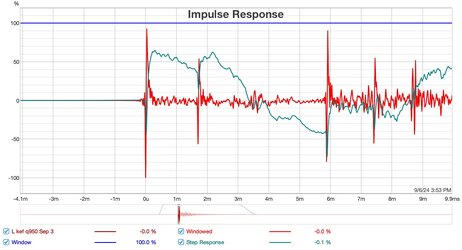
This isn't the same measurement I was referring to earlier since the step response here looks time-aligned, but it's alright. The same principles are relevant. Your frequency response shows a great deal of reflection energy from 300Hz up, which correlates to what we see in the following graphs.

1725814883104.png


Here I've marked all of the major problematic reflections and what the common culprit is for each of them, assuming that this measurement was taken from your main listening position and at ear height. If it was taken from somewhere else, this info won't hold up too well.

1725811945432.png


A. This is usually from a surface near the speaker somewhere. If the speaker is a floor-stander, the culprit is probably the floor. Bookshelf speakers usually don't have 2ms reflections if they are on taller stands. Typically these reflections show up if the speaker is on a desk or closer to the ground.

B. This reflection is almost as intense as your main pulse, which is a problem indeed. We want to see those reflections down around 10% or lower, not 90%. I'd say that this one here at 6ms is likely your ceiling. It could also be a side wall, but without the right speaker response to compare it to, it's not clear.

C-D. These could be anything from your side walls to your rear wall. Without the right speaker response, and without knowing your room's dimensions, it's difficult to tell.

E-F. These are from either your rear wall or one of the rear corners. Again, without the right speaker response, and without knowing your room's dimensions, it's difficult to tell.

G. Very likely a faraway surface like the rear wall or a rear corner. Once we get beyond 14ms it's almost certainly some distant surface somewhere. It would be interesting to see the other speaker response, and if it shows up there as well.

H. Unknown. 46ms is equivalent to around 49ft, which would mean that the surface is at least 24ft away.


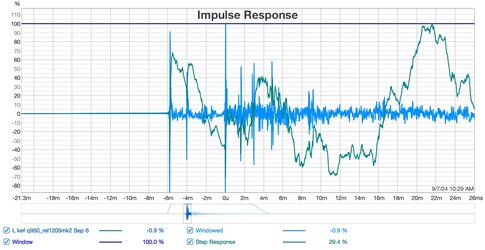
The step response shows us the same information as the ETC but with emphasis on the lower frequencies. This is useful because the ETC is biased toward higher frequencies and doesn't really show the bass at all. I've marked where the ETC reflections are for reference, but there are other things to point out.

The first 20ms are critical to the step, but since I don't have the right speaker response I can't tell what the IACC (ICCC) looks like.

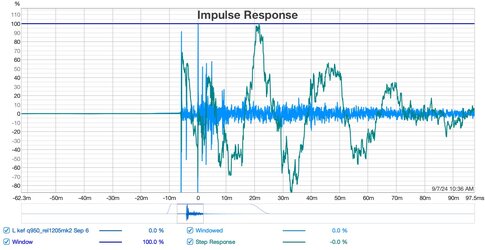
The step should gradually wind down, with the initial pulse and each successive crest being more intense than the next crest. You have a crest there at 27ms that's more powerful than the initial pulse, and the crest around 50ms is rivaling the pulse. Oscillation continues past 260ms. Ideally it should settle out between 100ms and 200ms. I have attached a screenshot below showing a more ideal step response and the frequency response that generates it.

1725812474119.png


Minimum phase step simulation:
1725816515999.png


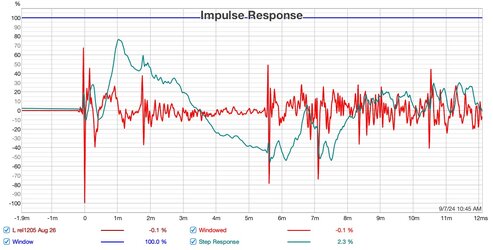
Filtered frequency response simulation:
1725816601530.png


Note that the cleaned-up low end yields a more controlled step response. This is a minimum phase simulation based on a correction filter I made from your measurement. The real-world response will not look like that unless you implement some damping (absorption/diffusion) and get those reflections under control.
 
Last edited:

Chris A

Member
Joined
May 22, 2017
Messages
66
Location
Arlington, Tx
More  
Preamp, Processor or Receiver
Emotiva XMC-1 AVP, Xilica XP-8080 & miniDSP 2x4 HD
Main Amp
First Watt F3, Crown D75-As (5 total) bi-amping
Additional Amp
Crown XTi-1000 for subwoofers (2)
DAC
Topping D10 Balanced (stereo only mode)
Universal / Blu-ray / CD Player
LG UBK90, Oppo BDP-103, Laptop
Front Speakers
Klipsch Jubilees (TAD TD-4002 compression drivers)
Center Channel Speaker
K-402-Multiple Entry Horn (full range)
Surround Speakers
Klipsch Belle bass bins with ESS AMT-1, bi-amped
Surround Back Speakers
-
Front Height Speakers
-
Subwoofers
DIY SPUD Tapped Horn (2) behind fronts
Rear Height Speakers
-
Screen
LG OLED 77"
Remote Control
Logitech Harmony One
Here is a transfer function plot from your REW measurement file showing the amplitude and phase responses in-room as measured by the microphone. Note the flatness of the minimum-phase response and the extreme cycling of the excess phase response. This says that you've potentially got very good loudspeakers from a time-based response standpoint (the flat gray line below other plots), but the room/microphone position are significantly affecting the excess phase response (i.e., non-minimum-phase room reflections--solid white line):

KEF Q950 Transfer Function Response (Paul8 Listening Room).jpg


The fact that the excess phase response is swinging both positive (upwards) and then strongly negative (downwards) says that the magnitude of the reflections are on the order of the direct arrivals from the loudspeaker. I have to say, I've not seen such sharp reflections in-room before. Perhaps a picture of your room with loudspeakers and microphone placement might lend a clue to what is occurring.

Chris
 

paul8

New Member
Thread Starter
Joined
Nov 21, 2022
Messages
31
More  
Preamp, Processor or Receiver
Yamaha RX-A3080
Front Speakers
Jamo
Subwoofers
REL
Here is a transfer function plot from your REW measurement file showing the amplitude and phase responses in-room as measured by the microphone. Note the flatness of the minimum-phase response and the extreme cycling of the excess phase response. This says that you've potentially got very good loudspeakers from a time-based response standpoint (the flat gray line below other plots), but the room/microphone position are significantly affecting the excess phase response (i.e., non-minimum-phase room reflections--solid white line):

View attachment 73504

The fact that the excess phase response is swinging both positive (upwards) and then strongly negative (downwards) says that the magnitude of the reflections are on the order of the direct arrivals from the loudspeaker. I have to say, I've not seen such sharp reflections in-room before. Perhaps a picture of your room with loudspeakers and microphone placement might lend a clue to what is occurring.

Chris
Nothing special about my room, 300 sq ft, with cathedral ceilings, the speakers are against the longer wall, the mic is on the tripod on my couch at ear height.
 

Chris A

Member
Joined
May 22, 2017
Messages
66
Location
Arlington, Tx
More  
Preamp, Processor or Receiver
Emotiva XMC-1 AVP, Xilica XP-8080 & miniDSP 2x4 HD
Main Amp
First Watt F3, Crown D75-As (5 total) bi-amping
Additional Amp
Crown XTi-1000 for subwoofers (2)
DAC
Topping D10 Balanced (stereo only mode)
Universal / Blu-ray / CD Player
LG UBK90, Oppo BDP-103, Laptop
Front Speakers
Klipsch Jubilees (TAD TD-4002 compression drivers)
Center Channel Speaker
K-402-Multiple Entry Horn (full range)
Surround Speakers
Klipsch Belle bass bins with ESS AMT-1, bi-amped
Surround Back Speakers
-
Front Height Speakers
-
Subwoofers
DIY SPUD Tapped Horn (2) behind fronts
Rear Height Speakers
-
Screen
LG OLED 77"
Remote Control
Logitech Harmony One
Note that drop-off in amplitude response above 10 kHz. I'd set the microphone vertical position to be centered on the high frequency driver centerline to see if that downward slope in amplitude response is real. It looks like you took a measurement with the microphone off-axis to the highest frequency driver. (There are psychoacoustic reasons for why you should always take the measurement on-axis with the highest frequency drivers.)

A picture of the setup with microphone tells much more than 1000s of words.

I'd certainly move that microphone to within 1m of the loudspeaker front baffle. Then take another measurement.

Chris
 

moedra

Member
Joined
Mar 1, 2021
Messages
130
Here is a transfer function plot from your REW measurement file showing the amplitude and phase responses in-room as measured by the microphone. Note the flatness of the minimum-phase response and the extreme cycling of the excess phase response. This says that you've potentially got very good loudspeakers from a time-based response standpoint (the flat gray line below other plots), but the room/microphone position are significantly affecting the excess phase response (i.e., non-minimum-phase room reflections--solid white line):

View attachment 73504

The fact that the excess phase response is swinging both positive (upwards) and then strongly negative (downwards) says that the magnitude of the reflections are on the order of the direct arrivals from the loudspeaker. I have to say, I've not seen such sharp reflections in-room before. Perhaps a picture of your room with loudspeakers and microphone placement might lend a clue to what is occurring.

Chris
This is really nice. How did you generate that?
 

Chris A

Member
Joined
May 22, 2017
Messages
66
Location
Arlington, Tx
More  
Preamp, Processor or Receiver
Emotiva XMC-1 AVP, Xilica XP-8080 & miniDSP 2x4 HD
Main Amp
First Watt F3, Crown D75-As (5 total) bi-amping
Additional Amp
Crown XTi-1000 for subwoofers (2)
DAC
Topping D10 Balanced (stereo only mode)
Universal / Blu-ray / CD Player
LG UBK90, Oppo BDP-103, Laptop
Front Speakers
Klipsch Jubilees (TAD TD-4002 compression drivers)
Center Channel Speaker
K-402-Multiple Entry Horn (full range)
Surround Speakers
Klipsch Belle bass bins with ESS AMT-1, bi-amped
Surround Back Speakers
-
Front Height Speakers
-
Subwoofers
DIY SPUD Tapped Horn (2) behind fronts
Rear Height Speakers
-
Screen
LG OLED 77"
Remote Control
Logitech Harmony One
Within REW, that's the "SPL & Phase" plot, with dark background (preferences: preferences:view:colour scheme-dark), then:

graph: 1/12 smoothing,
actions:generate minimum phase...,
actions:unwrap phase.

The scale limits are set appropriately within the field of the plot by the pop-up zoom controls near the ends of each scale direction (hor, vert).

Here is the spectrogram view showing the strong reflections:

KEF Q950 Spectrogram (Paul8 Listening Room).jpg


and the excess group delay plot showing the very noisy (room reflection) conditions up to ~6 kHz:

KEF Q950 group delay response (Paul8 Listening Room).jpg


Anywhere the excess group delay curve is non-flat typically indicates frequency bands where EQ (amplitude and/or phase) cannot be used to correct the response. These are regions of room reflections or perhaps non-minimum-phase reflections from within the loudspeaker cabinet itself. Any group delay values above ~1 ms is audible within the 300-10,000 Hz band.

Here is another loudspeaker having treated room acoustics (controlled early reflections) and full-range directivity, for comparison, using the same scale factors as above:

K-402-MEH Excess Group Delay, Mic at 1m.jpg


Chris
 
Last edited:

moedra

Member
Joined
Mar 1, 2021
Messages
130
Thanks for clarifying, but for some reason I'm unable to replicate what you have there. I'm not sure what's different here.
 
Last edited:

Chris A

Member
Joined
May 22, 2017
Messages
66
Location
Arlington, Tx
More  
Preamp, Processor or Receiver
Emotiva XMC-1 AVP, Xilica XP-8080 & miniDSP 2x4 HD
Main Amp
First Watt F3, Crown D75-As (5 total) bi-amping
Additional Amp
Crown XTi-1000 for subwoofers (2)
DAC
Topping D10 Balanced (stereo only mode)
Universal / Blu-ray / CD Player
LG UBK90, Oppo BDP-103, Laptop
Front Speakers
Klipsch Jubilees (TAD TD-4002 compression drivers)
Center Channel Speaker
K-402-Multiple Entry Horn (full range)
Surround Speakers
Klipsch Belle bass bins with ESS AMT-1, bi-amped
Surround Back Speakers
-
Front Height Speakers
-
Subwoofers
DIY SPUD Tapped Horn (2) behind fronts
Rear Height Speakers
-
Screen
LG OLED 77"
Remote Control
Logitech Harmony One
In this case, do not use "Estimate IR Delay", since it will move the peak of the impulse response several milliseconds to the right (in this particular case, only) and then you'll get a phase response curve that's miles long (in the vertical direction) in the plot window. When I bring up the original measurement file, I can see visually that the IR delay is set correctly as-is, so do not change it in this particular case.

Chris
 
Top Bottom