Hi all, I hope you might be able to help me. I've recently moved my studio to a larger, but annoyingly square room. Monitor speakers are Yamaha HS7 with an HS8S Sub. I've built 11 acoustic panels including two bass traps. I've used Sonarworks which seems to be measuring a reasonably flat spectrum, but getting the sub integrated is slightly challenging.
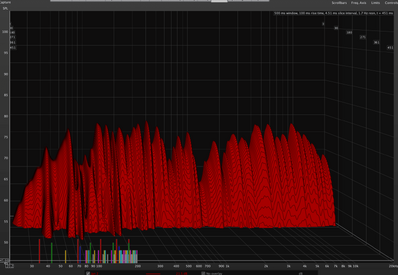
I've used REW to capture measurements, but am not really sure how to analyse them. I've attached the waterfall graph shown with 1/12 smoothing. To my not very well trained eyes it looks pretty good I think, but I don't really know what I'm looking at especially in comparison to the RT60 decay. My interpretation is that everything is decaying quickly enough and that the EQ is ok, with no major abnormalities. There's a consistent dip in Sonarworks at around 1k of a few Db, so I'm relying on the Sonarworks correction to sort that.
Would anyone with considerably more tech knowledge be able to comment on my results?
Thank you so much in advance.
Graham