cookiedivine
Registered
Thread Starter
- Joined
- Jul 10, 2021
- Posts
- 8
Hi all,
I've been having some trouble with the trace arithmetic function in REW.
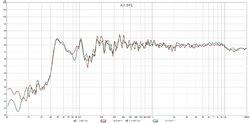
I'm trying to generate a graph showing the difference between the left & right speakers so I can determine the optimal mixing position. Here are the SPL curves for both speakers:

And here's what I get when I do 'A / B' where L & R are A & B respectively:

From around 200Hz upwards the difference curve seems to be slowly rising. Normally, this would indicate that the L speaker is louder than the R speaker in the mid-high freqs, but look at the first image. That clearly isn't the case (in fact, from around 2KHz and above, R is clearly louder)
So I generated a (B / A) graph and compared it to the original (A / B) curve:

(B / A) should be an exact flip of (A / B) around the 0dB line, but it isn't. From around 200Hz upwards the 'reflection line' seems to be rising, with both curves fluctuating around it.
So I multiplied (A / B) by (B / A) and it pretty much confirmed my suspicions:

This line should be completely flat at 0dB, no? A curve should be completely cancelled out by its inverse.
I suspect this is a problem with the current version of REW as I tried re-creating a difference graph from 2017 using the same .mdat file and my version has the same weird rise from around 200Hz upwards:


(My one is the 2nd one)
Can anyone help me out with this? Am fairly new to all this so pls be gentle
(Have attached the .mdat file)
I've been having some trouble with the trace arithmetic function in REW.
I'm trying to generate a graph showing the difference between the left & right speakers so I can determine the optimal mixing position. Here are the SPL curves for both speakers:
And here's what I get when I do 'A / B' where L & R are A & B respectively:
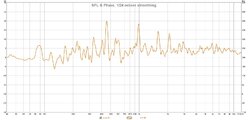
From around 200Hz upwards the difference curve seems to be slowly rising. Normally, this would indicate that the L speaker is louder than the R speaker in the mid-high freqs, but look at the first image. That clearly isn't the case (in fact, from around 2KHz and above, R is clearly louder)
So I generated a (B / A) graph and compared it to the original (A / B) curve:
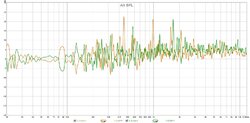
(B / A) should be an exact flip of (A / B) around the 0dB line, but it isn't. From around 200Hz upwards the 'reflection line' seems to be rising, with both curves fluctuating around it.
So I multiplied (A / B) by (B / A) and it pretty much confirmed my suspicions:
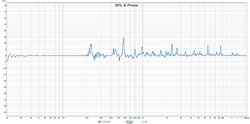
This line should be completely flat at 0dB, no? A curve should be completely cancelled out by its inverse.
I suspect this is a problem with the current version of REW as I tried re-creating a difference graph from 2017 using the same .mdat file and my version has the same weird rise from around 200Hz upwards:
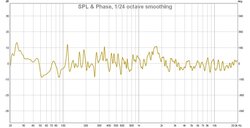
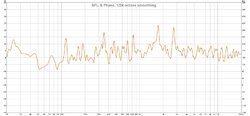
(My one is the 2nd one)
Can anyone help me out with this? Am fairly new to all this so pls be gentle

(Have attached the .mdat file)
Attachments
Last edited:


