RTA measurements RMS saved with inconsistent values

Sacenti

Member
Thread Starter
Joined
Jul 2, 2017
Posts
59
I would greatly appreciate your help in solving my problem of saving REW RTA measures - I am certainly doing something wrong!
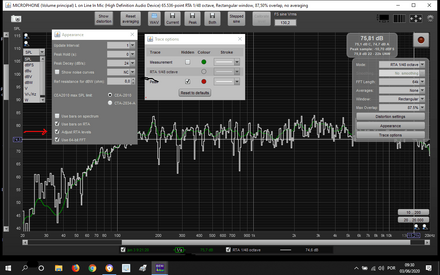
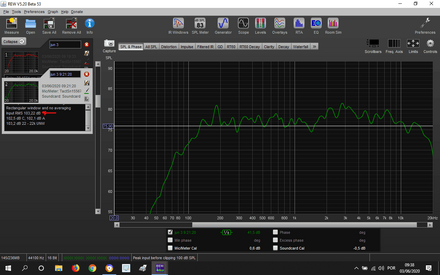
See the measurement screen below REW RTA1, REW measures at RTA 75.8 dB, RTA settings are in the auxiliary windows, here I am using adjust RTA level, the average value of 75.8 dB is consistent on the vertical axis, when saved in the current measurement button, see what appears in the notes field on the screen below REW RTA1a:
The RMS input value after saving, changed to 103.22 dB - why did it change from 75.8 dB to 103.2dB ???
 

Attachments

  • REW RTA1.png
    REW RTA1.png
    53.9 KB · Views: 16
  • REW RTA1a.png
    REW RTA1a.png
    44.5 KB · Views: 13

Sacenti

Member
Thread Starter
Joined
Jul 2, 2017
Posts
59
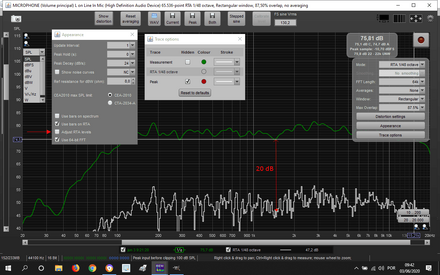
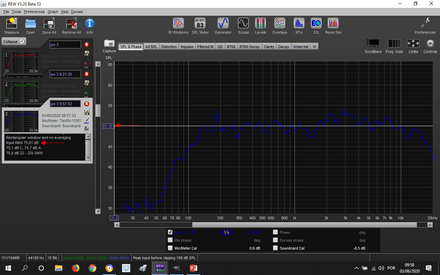
I redid the RTA parameterization, see figure RTA2, uncheck adjust RTA level, and saved it again, see what happened now in fig RTA2a at 75.8 dB - the saved measurements are consistent with the RTA measurement, but the graph has dropped approximately 20dB in relation to the vertical axis ??? The saved curve is not consistent with the measurement! Where did I go wrong?
I have already installed the REW, installed it in a new folder, recalibrated the soundcard, changed the notebook, but the inconsistency continues ... I have been using REW for a few years and recently, after updating the versions, this started to appear. I would be very grateful for someone's help, please!
(Shift + Left, Right, Up, Down - move graph not working)
 

Attachments

  • REW RTA2.png
    REW RTA2.png
    55.9 KB · Views: 11
  • REW RTA2a.png
    REW RTA2a.png
    48.2 KB · Views: 11

John Mulcahy

REW Author
Joined
Apr 3, 2017
Posts
8,173
It is a bug, the values in the notes include the RTA level adjustment. I have fixed it for the next beta, in the meantime a workaround is not to select "Adjust RTA levels". Adjust RTA levels artificially shifts the graph upwards to provide a view more consistent with what would be obtained from a sweep measurement at the same level. From the help:

The RTA plot shows the energy within each octave fraction bandwidth. As the RTA resolution increases, from 1 octave through to 1/48 octave, the octave fraction bandwidths decrease and, for broadband test signals such as pink noise, the energy in each octave fraction decreases correspondingly. Whilst the RTA is correctly showing the actual level within each octave fraction, this variation of trace level with RTA resolution can be awkward when using the RTA with a pink PN noise signal to adjust speaker positions or equaliser settings. The Adjust RTA Levels option offsets the levels shown on the RTA plot to compensate for both the bandwidth variation as resolution is changed and the difference between a sweep measurement at a given sweep level and a pink PN RTA measurement at the same level, allowing direct comparison between RTA and sweep plots. Whilst the levels shown are not the true SPL in each octave fraction, they are more convenient to work with. N.B. This option should only be used with broadband test signals, such as pink noise or pink PN.
 

Sacenti

Member
Thread Starter
Joined
Jul 2, 2017
Posts
59
Thanks for the promptness John! You are very efficient! I will wait for the new version.
 
Top Bottom