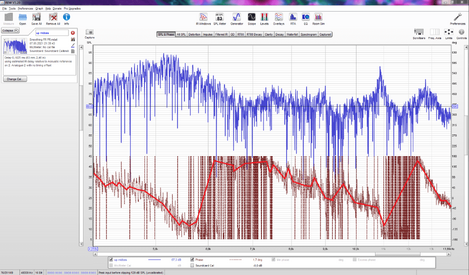
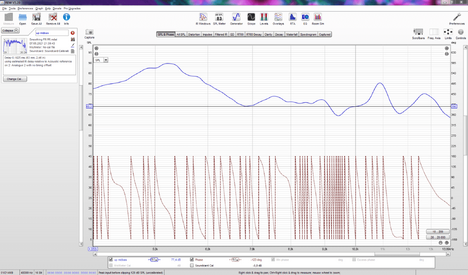
Question to John Mulcahy: When I look at the frequency response graph without smoothing, it is difficult to read. After smoothing 1/48, reads well and looks like it has been squeezed at the top and bottom. That is, it retains all tilts and turns, but is easy to read. The phase response graph before smoothing looks like the frequency response graph, but many vertical lines were placed on top of it. It seems that after smoothing, all vertical lines will be removed and the graph picture will remain, but slightly compressed from above and below. But after smoothing, even 1/48, picture of the graph is lost, disappears, except for the lower frequencies. Is there another smoothing method, after applying which the main picture of the phase response graph would remain, as is the case with the frequency response graph?
With the red curve, I drew the main picture of the phase response graph, which should remain after smoothing.
With the red curve, I drew the main picture of the phase response graph, which should remain after smoothing.


