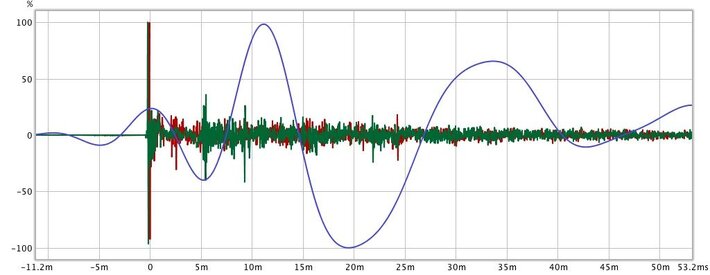
I'm trying to set up time parameters for my sub. I've been able to look at the frequency response plots to make sure the phase is correct, but trying to determine time delay is giving me vague results.
First of all, I measured the distances to the sub and mains; due to circumstances beyond my control, the sub is slightly closer and off to one side. The mains are about 12 feet away, 4 feet in front of the wall, and the sub is roughly 7 feet away, closer to the right wall. Changing this layout is physically almost impossible in the room I have, but with some effort I have gotten the frequency reponse to work out well; it is crossed over at 60 Hz so localization should be (and appears to be) a non-issue. But due to the configuration, I need to add delay to the sub instead of the reverse. My measurements told me about 4.5 mS of added delay (5' difference in the distances). The raw data from the REW info panel says about 2.0 mS though (possibly due to differences in the DSP channels?). Audibly, I think the 4.5 mS sounds a bit cleaner - better transients. But I accept that might be confirmation bias, so I decided to do a full FR/impulse plot with REW and see whether it agreed with me.
The problem is that using sub delays of 0, 2, 4.5, and 6 mS seem to generate plots which are only subtly different and none of them look "better" to me. I don't see a clear contribution from the sub, though there is a 'bump' in the step response which moves as I change the delay and it's way beyond the delay parameter - on the order of 15 mS - so it's probably a reflection. Rather than clutter up this thread with 50 ad-hoc different graphs, what should I post to give the most useful data, and with what settings to make the data clearer? I have 4 full sets of data, so I can post pretty much anything. Impulse, filtered IR, Spectrogram, waterfall.... What would you like to see? I'm not busy this weekend so I'll be able to test and re-post if desired.


