mamba76
New Member
More
- Preamp, Processor or Receiver
- Lenovo M8 FHD tablet
- Main Amp
- JL Audio XD600/6 (front end)
- Additional Amp
- JL Audio XD400/4 (midbass)
- Other Amp
- JL Audio XD1000/1 (sub)
- Streaming Equipment
- miniDSP 2x4HD feeding C-DSP6x8
- Front Speakers
- Focal Utopia (2003 model) (6W2's + TN51's)
- Surround Back Speakers
- JL Audio ZR800s (pair)
- Subwoofers
- JL Audio 13W3 4ohm
Hi all. Iv been using REW for tuning my cars 7 way system for about 2 years now so have a fair bit of experience but there are some things I want to do that REW doesn't quite seem to be able to do.
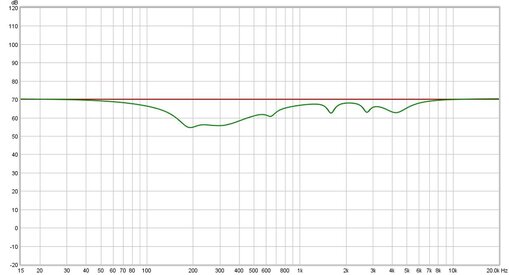
Basically I modified the data in a psychoacoustic measurement text file so that all gain is set to 70db and and all phase is set to 0deg. This gives me, what I call, a 'Flat Line' graph I the import back into REW. I want to be able to add the predicted response of a filter set to this 'flat line' FR plot so I can manipulate the resulting graph with the trace arithmetic tools. That's it! Sounds simple but I can't find anything on the web that can do this unless you want to pay £300 for software like Acourate Convolver which I briefly looked at. Not even sure if that will do what I want.
Im doing my own maths for balancing the FR at both ears for my cars two main speakers. I have the data I need now but just need this last tool so I can work with the results to create an equal correction filter set that I will add to the individually EQ'd speakers. I'm sure plenty of people can gauge what I'm trying to achieve here but I will keep it to myself until I can prove it works lol, if not I'm another step closer to madness!!
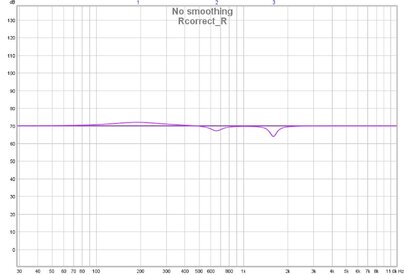
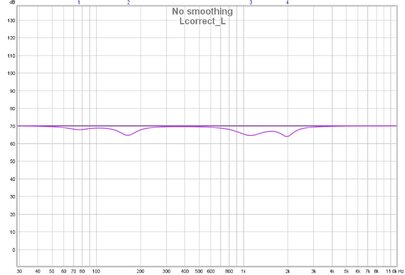
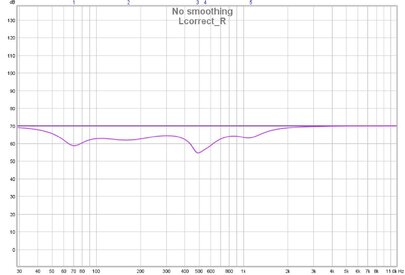
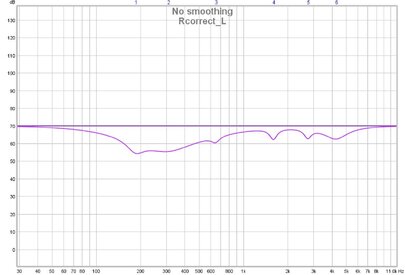
In the pictures I want to add each of the 4 filter sets to the 'flat line' measurement data to create 4 new measurements I can use in All SPL main window.
Thanks
ps I use a Minidsp cdsp6x8
Basically I modified the data in a psychoacoustic measurement text file so that all gain is set to 70db and and all phase is set to 0deg. This gives me, what I call, a 'Flat Line' graph I the import back into REW. I want to be able to add the predicted response of a filter set to this 'flat line' FR plot so I can manipulate the resulting graph with the trace arithmetic tools. That's it! Sounds simple but I can't find anything on the web that can do this unless you want to pay £300 for software like Acourate Convolver which I briefly looked at. Not even sure if that will do what I want.
Im doing my own maths for balancing the FR at both ears for my cars two main speakers. I have the data I need now but just need this last tool so I can work with the results to create an equal correction filter set that I will add to the individually EQ'd speakers. I'm sure plenty of people can gauge what I'm trying to achieve here but I will keep it to myself until I can prove it works lol, if not I'm another step closer to madness!!
In the pictures I want to add each of the 4 filter sets to the 'flat line' measurement data to create 4 new measurements I can use in All SPL main window.
Thanks
ps I use a Minidsp cdsp6x8