Before EQ and after EQ measurements - please advise if this is correct

blackhole

Registered
Thread Starter
Joined
Mar 2, 2023
Posts
13
Hello REW experts,
In a small room using a vintage Sherwood s-7200 and PSB Alpha B bookshelf speakers in near field setup.
Using SMSL DAC via USB with PC as the source.
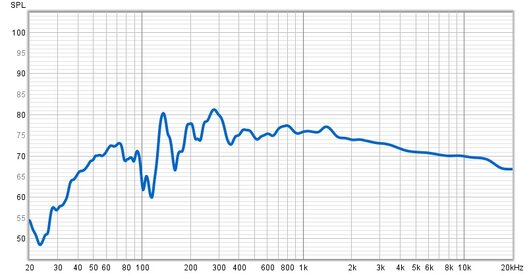
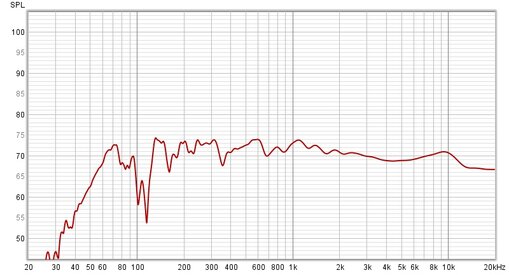
Using UMIK-1 and REW software please see attached curves before and after EQ.
Does the curve post EQ look correct? Please advise.
I used house curve based on Julian Krause video for filters.
Is there more information needed to asses these graphs?
I am using Equalizer APO.

before-eq.PNG
after-eq.PNG
rew-preferences-1.PNG
 
Doesn’t appear to be enough difference between the before and after to make an audible difference. What do your ears tell you?

Regards,
Wayne
 
i am changing the target DB level to 70.
So should i try different target levels until the sound is satisfactory?

rew-eq-filters.PNG
 
i am changing the target DB level to 70.
So should i try different target levels until the sound is satisfactory?

View attachment 73705
Hi,

If I understood correctly, you want to avoid any boost. You have 2 nulls at 87 and 105 Hz Therefore as a starting point, I would place the target below those nulls. Also adjust the crossover HP cutoff to match the natural slope of your RMS average. Here's an example. Lastly set the individual max boost to 0. If I made mistakes, please feel free to correct me. This would be my first 'diagnostic'.

Capture d’écran du 2024-09-15 09-20-12.png
 
It's probably much better to do an inversion, but that requires convolution. Are you are implementing the filters as data typed into an equalizer? Or are you using impulse responses in a convolver? I haven't used Equalizer APO in ages, but I know it can do both.
 
Hi,

If I understood correctly, you want to avoid any boost. You have 2 nulls at 87 and 105 Hz Therefore as a starting point, I would place the target below those nulls. Also adjust the crossover HP cutoff to match the natural slope of your RMS average. Here's an example. Lastly set the individual max boost to 0. If I made mistakes, please feel free to correct me. This would be my first 'diagnostic'.

View attachment 73707
Thanks. I followed your steps.Please see attached before-EQ and after-EQ photos attached.
 

Attachments

  • rew-before-eq.jpg
    rew-before-eq.jpg
    117.2 KB · Views: 43
  • rew-after-eq.jpg
    rew-after-eq.jpg
    118.6 KB · Views: 51
Thanks. I followed your steps.Please see attached before-EQ and after-EQ photos attached.
Hi @blackhole

You have more linearity in the highs. I would have expected a more extended bass response (you lost a lot of frequencies below 55-60Hz) as well as a significant drop in SPL but at least you flattened the peaks in the bass region to some extent. Those dips in the bass region are caused by room and cannot be equalized: changing speaker location and room treatment is required (diffusion/absorption). You could post your mdat file and I would have a look to see if everything is related in context.

If youre using EQ, please do tell; however if you're able to use convolution (inversion), @moedra has made an excellent tutorial at https://nverxion.wixsite.com/meridiansoundworks/drc-rew and this whole thread would be of interest to you: https://www.avnirvana.com/threads/convolution-room-correction-and-room-curve.14005/page-2

You haven't specified. The after curve. Is it a result of afterwards measurements or calculated / predicted?

Best regards,
 
Thanks. I followed your steps.Please see attached before-EQ and after-EQ photos attached.
If you do decide to follow my tutorial, my recommendation in the target design section is to place the target level somewhere between 69dB and 72dB, which is specific to your measurements. You will need to ignore the deep dip around 110Hz, which is a boundary interference null.
 
Some before and after graphs for us to evaluate would be helpful.

Regards,
Wayne
 
Back
Top