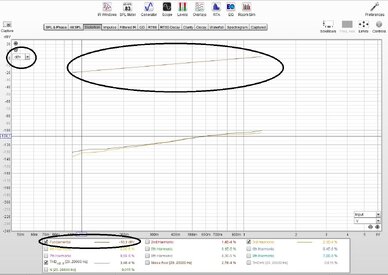
Hi. I don't understand a thing. When I view the distortion versus input voltage graph
and select dB for the Y axis, the graph is clear to me.

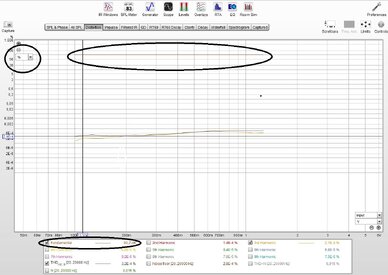
But when I change for the y axis from dB to % the
input signal (in the graph) is represented as a constant with a very high dB value.

Thanks for those who want to help me
and select dB for the Y axis, the graph is clear to me.

But when I change for the y axis from dB to % the
input signal (in the graph) is represented as a constant with a very high dB value.

Thanks for those who want to help me


