Measuring with a timing reference

sm52

Member
Thread Starter
Joined
Mar 14, 2019
Posts
1,021
jtalden, I tried to understand, figure it out, but so far it has not worked. Thank you. I imagined that when several speakers are working together, but they are not consistent with each other, then the Step Response graph should have several separate peaks from each speaker at the beginning of the Step Response graph. And the temporary distance between these peaks will show how many mm you need to move one of the speakers so that they work accurately in time. Maybe this is not on my graph, because my dynamics are consistent in time. I want to see something like this on my graph:
the delay between the 2 drivers is 0.295 ms.
or
the delay between the 2 drivers is 0.34 ms.
 
Last edited:

jtalden

Senior Member
Joined
May 22, 2017
Posts
891
Location
Arizona, USA
More  
Preamp, Processor or Receiver
Marantz AV7705 Pre/Pro
Main Amp
VTV 6 chnl NC252MP P-amp x 2
Additional Amp
Behringer DCX2496 x 2
Universal / Blu-ray / CD Player
OPPO BDP-103 Universal Player
Front Speakers
DIY SEAS H1456/H1212 Spkr x 5
Subwoofers
DIY JBL 2235H 15" SW x 2
Screen
Da-Lite Da-Snap 39105V - 92"
Video Display Device
JVC DLA-X790R
Once they are combined it is difficult to say how the drivers are interacting to form the step response of the combined measurement. It's easier to overlay the individual drivers as explained above.

There is really nothing much to learn from this exercise. The AT tells us all the information that is needed to create the best XO timing. You may be mixing guidance from other methods of setting delay timing. Other methods may, or may not, work as well as this one. There is no reason to mix the two together however.
 

jtalden

Senior Member
Joined
May 22, 2017
Posts
891
Location
Arizona, USA
More  
Preamp, Processor or Receiver
Marantz AV7705 Pre/Pro
Main Amp
VTV 6 chnl NC252MP P-amp x 2
Additional Amp
Behringer DCX2496 x 2
Universal / Blu-ray / CD Player
OPPO BDP-103 Universal Player
Front Speakers
DIY SEAS H1456/H1212 Spkr x 5
Subwoofers
DIY JBL 2235H 15" SW x 2
Screen
Da-Lite Da-Snap 39105V - 92"
Video Display Device
JVC DLA-X790R
I just saw your imbedded charts. How do we see that there is a close phase tracking of the direct sound throughout the entire XO range with those charts - we can't see that. It is clear the timing is in the correct range and those settings may be ideal, but we can't really confirm that from the charts. The correct relative location of the the 2 drivers step responses and the resulting shape of the combined step response depends primarily on the shape of the acoustic SPL handoff. That is, the SPL rolloff shape of the 2 drivers. We can only talk of the appearance of the combined step response when we specify we have an acoustic LR-24 or some other specifically defined XO. We rarely have that situation unless we do a lot if filter work to create it.
 

sm52

Member
Thread Starter
Joined
Mar 14, 2019
Posts
1,021
Hi. Happy New Year everyone! Question about Impuls graphics. For example a graph like in post # 118. If after the first peak of an impulse that goes up, there is a larger peak that goes down, then REW puts the Ref point at the second peak. Can you explain why the Ref point is not placed on the first peak?
 

sm52

Member
Thread Starter
Joined
Mar 14, 2019
Posts
1,021
If the time between the first positive peak and the second negative (the second is greater than the first) is 30 µs, changing the Ref point from the second to the first does not change the IR and Magnitude graphs. No changes by sight. Can I leave Ref as it is - at the second negative peak?
 

John Mulcahy

REW Author
Joined
Apr 3, 2017
Posts
8,174
Yes. The only effect is on the phase response and parameters derived from it, such as group delay.
 

sm52

Member
Thread Starter
Joined
Mar 14, 2019
Posts
1,021
When I move the Ref point, how can I see the real-time change in the phase response? Which is displayed on the SPL & Phase tab.
 

sm52

Member
Thread Starter
Joined
Mar 14, 2019
Posts
1,021
Impulse graph -> Offset t=0
Here you can move the time zero point. The phase response appears in the lower half of the graph and changes in real time. I asked about the same, but for the Ref point, which is above the IR, in the form of a blue flag.
 

John Mulcahy

REW Author
Joined
Apr 3, 2017
Posts
8,174
Sorry, I misread. Moving the reference point will have next to no effect on anything unless it is moved so far the main part of the impulse response no longer lies within the windowed region.
 

sm52

Member
Thread Starter
Joined
Mar 14, 2019
Posts
1,021
I saw everything that you wrote about. Thank you.
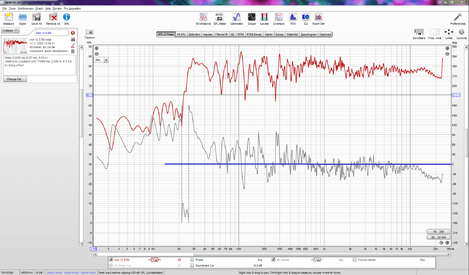
There is a suggestion. The SPL & Phase tab can have two graphs at the same time. It is not very important for the frequency response graph that the 0 dB line is highlighted. But for the minimum phase (and phase) graph, it would be helpful to highlight the 0 degree line. It is possible not to reach the left scale so that the graph of the minimum phase (and phase) is easy to read. In the picture, I have drawn the 0 degree line in blue. Do you will think?
 

Attachments

  • graph.PNG
    graph.PNG
    151.7 KB · Views: 30
Last edited:

sm52

Member
Thread Starter
Joined
Mar 14, 2019
Posts
1,021
Impulse graph. There are measurements of 4 speakers in a common enclosure from the same point in space. Are there any rules or criteria in which position to manually set t = 0? Could t = 0 be after the peak of the impulse?
 

jtalden

Senior Member
Joined
May 22, 2017
Posts
891
Location
Arizona, USA
More  
Preamp, Processor or Receiver
Marantz AV7705 Pre/Pro
Main Amp
VTV 6 chnl NC252MP P-amp x 2
Additional Amp
Behringer DCX2496 x 2
Universal / Blu-ray / CD Player
OPPO BDP-103 Universal Player
Front Speakers
DIY SEAS H1456/H1212 Spkr x 5
Subwoofers
DIY JBL 2235H 15" SW x 2
Screen
Da-Lite Da-Snap 39105V - 92"
Video Display Device
JVC DLA-X790R
Impulse graph. There are measurements of 4 speakers in a common enclosure from the same point in space. Are there any rules or criteria in which position to manually set t = 0?
If doing a delay timing offset study then the relative spacing between the 4 impulses must be maintained if they are offset. This can be done manually one impulse at a time, or by using 'set t=0 at cursor' in the chart controls of the overlay impulse chart. This will offset all 4 impulses together if all 4 are selected in the legend.
Could t = 0 be after the peak of the impulse?
The further the tweeter is from t=0 the more the phase is rotated making it difficult to interpret and some of the other charts are shifted. For understanding, it is best to spend some time to move t=0 to different positions to see the impact on the charts yourself. A very small change in t=0 has large phase impact at high frequency, but very little at low frequency.

If you intend to use the spectrogram method discussed above, set t=0 at the impulse peak of the tweeter.

[For those using the REW alignment tool the position of t=0 can usually be left as measured as there is a button in the tool to level the phase at the cursor frequency is needed.]
 

sm52

Member
Thread Starter
Joined
Mar 14, 2019
Posts
1,021
jtalden
For now, I have been using how REW sets the t = 0 position after pressing Estimate IR Delay. Are you saying that in order to align the four graphs in time, need have to move t = 0 to the peak of the tweeter impulse, remember the shift, and apply the same shift to all other impulses?
 

jtalden

Senior Member
Joined
May 22, 2017
Posts
891
Location
Arizona, USA
More  
Preamp, Processor or Receiver
Marantz AV7705 Pre/Pro
Main Amp
VTV 6 chnl NC252MP P-amp x 2
Additional Amp
Behringer DCX2496 x 2
Universal / Blu-ray / CD Player
OPPO BDP-103 Universal Player
Front Speakers
DIY SEAS H1456/H1212 Spkr x 5
Subwoofers
DIY JBL 2235H 15" SW x 2
Screen
Da-Lite Da-Snap 39105V - 92"
Video Display Device
JVC DLA-X790R
The method you are using also should put the t=0 near the peak of the tweeter IR. Is that not working? If not please post an mdat showing that.
 

sm52

Member
Thread Starter
Joined
Mar 14, 2019
Posts
1,021
REW itself sets t = 0 before the peak of the impulse. But, during the measurement, it often happens that the delay floats back and forth. Under the same measurement conditions. Next measurement in 1 minute. At the first measurement, REW determines the delay, I press Estimate IR Delay, shift and update timing offset. I take the second measurement. The delay should be = 0. But REW says the delay is 8 mm. I press Estimate IR Delay, shift and update timing offset. Two attempts should make the delay = 0. But after the third measurement, REW again says - the delay is -10 mm. Sometimes it turns out to get zero latency several times in a row. Then I trust that measurement. But this is sometimes, not always. So I decided to learn how to manually set t = 0. Therefore, I ask to tell how others do it, who understand how to do it correctly.
 

jtalden

Senior Member
Joined
May 22, 2017
Posts
891
Location
Arizona, USA
More  
Preamp, Processor or Receiver
Marantz AV7705 Pre/Pro
Main Amp
VTV 6 chnl NC252MP P-amp x 2
Additional Amp
Behringer DCX2496 x 2
Universal / Blu-ray / CD Player
OPPO BDP-103 Universal Player
Front Speakers
DIY SEAS H1456/H1212 Spkr x 5
Subwoofers
DIY JBL 2235H 15" SW x 2
Screen
Da-Lite Da-Snap 39105V - 92"
Video Display Device
JVC DLA-X790R
Please review or post an mdat of the TW measured several times using acoustic timing without any manual intervention after the measurements. If the impulses fall closely together when zoomed in there is no problem. The measured differences in the impulse peaks is the best indicator of true variability.

If REW calculates different delays in the notes for repeated woofer or midrange measurements that may be just due to
difficulty of calculating a lower frequency driver measured in a room at the same precision of a tweeter. A 10 mm difference on a woofer or midrange is trivial. That's about a 10° phase difference at 1 kHz if my math is correct. The best indicator is the overlay of the impulses. Again, an mdat example of repeated measurements of a woofer will indicate if there is a significant problem.

Manually choosing 'Estimate IR Delay' provides no value for a group of measurements for timing work as I think the calculation is redone using another calculation method that often results in slightly different values reported. I think that REW calculates the offset using a minimum phase response calculation rather than based on the peak location when this button is pushed. John would need to need to advise if I have this wrong.

If I knew for sure what method you were intending to use and had more info on what stage you are at in the process then I may be able to provide more specific help.
 

sm52

Member
Thread Starter
Joined
Mar 14, 2019
Posts
1,021
It turned out I had already asked a similar question. And for him I made 10 measurements. They are in post #16. They are saved with the time delay removed from them. Can you play around with t = 0 and name which offset to apply to, say, graph 1 of the first five.
 

jtalden

Senior Member
Joined
May 22, 2017
Posts
891
Location
Arizona, USA
More  
Preamp, Processor or Receiver
Marantz AV7705 Pre/Pro
Main Amp
VTV 6 chnl NC252MP P-amp x 2
Additional Amp
Behringer DCX2496 x 2
Universal / Blu-ray / CD Player
OPPO BDP-103 Universal Player
Front Speakers
DIY SEAS H1456/H1212 Spkr x 5
Subwoofers
DIY JBL 2235H 15" SW x 2
Screen
Da-Lite Da-Snap 39105V - 92"
Video Display Device
JVC DLA-X790R
name which offset to apply to, say, graph 1 of the first five
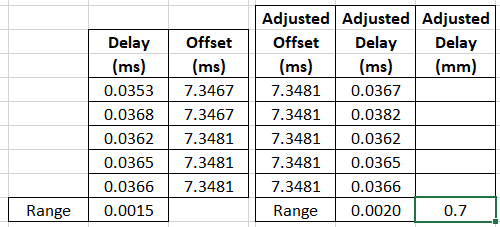
There is no significant difference in first mdat of Post-16. It will make no difference which of these measurements is used for timing adjustments. [Note: The midrange driver measurement is not normally used to establish the offset. Normally the tweeter offset is applied and used for all 4 drivers. If the wrong offset value is used we can always just shift the 4 driver group the same amount in the impulse overlay chart controls to place the tweeter impulse near 0 ms as mentioned in Post-139.]

The overlay chart below shows all 5 measurements are within 0.0016 ms (0.6 mm) of each other as close as I can measure. However, this is not the situation I asked for in that there were 2 different values used for the offset. In the table below I tried to adjust all 5 measurements to the same offset. I am not sure I did this correctly, but it suggests the variability range increases only slightly to about 0.0020 ms. This is still a trivial value for the purpose of setting delay timings. I presume the listeners ears will not be limited to a few mm range variation at the measured LP distance.
Impulse timing differences.jpg


Chart 145.png

If this is not just a generic question, I'm still waiting to learn what your process will be as some of my statements may be misleading depending on what you are planning. I think you intend to use spectrogram in some manner to find the needed offsets. Is that correct? If so, one option is to just measure the offset displayed on the spectrogram for each driver and adjusting the delay timing accordingly. It would then be necessary to confirm the polarity needed for the 3 lower frequency drivers to maximize the SPL in the XO ranges. There is no phase work needed and should result in a reasonable alignment.

There are other methods possible using the spectrogram including just using the delays reported in the measurement notes either with or without selecting the minimum phase offset. I haven't tried either of those and am a bit skeptical, but it may work fine. You may have found another method you intend to follow. Once you have good measurements on each of the 4 drivers It is easy enough to evaluate them all in REW several different ways.

If you provide 4 driver measurements with the same offset (any value) I can do an analysis using the alignment tool method if you like. You could use it as a benchmark to compare with the results of your process.
 

sm52

Member
Thread Starter
Joined
Mar 14, 2019
Posts
1,021
There is another problem that may be misleading REW. And it prevents me from defining t = 0 for the tweeter. This is the behavior of the sound card at the end of the range. Somewhere from 22 kHz to 24 kHz, the graph of the sound card drops sharply. It's about creating a calibration file with a Loop connection. After creating this file, all graphs have a tail up at 23.9 kHz. This is on the frequency response graph. The phase response graph shows incorrect data already from 22 kHz. Deleting data from 22 kHz and above gives the wrong result. Therefore, so cannot to do this. Measurements at 88.2 kHz and 96 kHz and then deleting data above 24 kHz cannot be used either. I checked. The result is incorrect. The most correct option is measurements at 48 kHz. Despite the incorrect data at the end of the range.
The Impuls graph control panel has a clock adjustment button. If you move it so that the graph moves to the left, then the amplitude of the impulse graph changes. In some position, the amplitude becomes higher than recorded by REW. But can't to leave it at this maximum amplitude, because also get wrong results. So it's better not to touch this button.
About floating delay. I've noticed that almost always after 30-40 minutes of measurements, REW accurately determine the delay. Several measurements one after the other give zero latency. Maybe this is because I am using scheme 1 shown in post #1?
 
Last edited:

John Mulcahy

REW Author
Joined
Apr 3, 2017
Posts
8,174
The calibration file is not used for timing purposes, it only affects the SPL and phase displayed values.
 

sm52

Member
Thread Starter
Joined
Mar 14, 2019
Posts
1,021
Is the phase response graph calculate from the frequency response data?
 

sm52

Member
Thread Starter
Joined
Mar 14, 2019
Posts
1,021
Does this mean that the impulse response of the measured system received through a sound card that does not have a perfectly flat response during calibration will give the same graphs as the impulse response of the measured system received through a sound card with a perfectly flat response during calibration?
 
Top Bottom