Matthew J Poes
AV Addict
- Joined
- Oct 18, 2017
- Posts
- 1,904
I took a few moments to make a quick example using drivers from Dayton Audio. The reference 8" driver, RS225P-8, and the waveguide loaded dome tweeter ND25FW-4.
First the response with text book crossovers 4th order LR at 2500hz, no response shaping.

You can see there isn't enough cut on the tweeter and the response is a little uneven. Notice the transfer function in the lower left corner. Good overlap there, looks like a good fit, but the response isn't good.

There is the drive responses overlayed to try to show whats going on. Clearly we have some driver response problems to tame. However, what I really wanted you to see what that open area between the black line and the red and blue driver lines. This is the point where the drivers are constructively adding on each other, if you will. If it really was just the sum of its parts, the response wouldn't look like that, it would dip down where the drivers dip down.

Look at that, much better right? Look at the transfer function now. It's been carefully shaped to flatten the driver response. I did this by adding more cut and adding in a bunch of PEQ filters.

Problem though, we never looked at the response at different angles. Once we look at 0 degrees and 30 degrees, we see some minor issues. First, the response is rolling off a lot in the very high frequencies and second, that the response isn't quite the shape we would want off axis. it's too flat out to 1khz.

In fact, by this point you want to start looking at hwat is going on at 45 degrees to make sure the response out to 45 degrees has the falling shape you want. As you can see, by adding some more PEQ, the transfer function looks very wacky, but the actual speaker response looks good for 45 degrees.

Now we look at 0 and 45 degrees and we see the response looks good through that range. We see that I actually made a flatness compromise on the axial response to ensure the off-axis response was smoother. This is why its so important to look at the polar data.
What do the filters look like to achieve that?


There is the woofer and tweeter filters. High and low pass plus PEQ to adjust. I didn't do any time delay in this, but in practice, you would also need to look at delay.
First the response with text book crossovers 4th order LR at 2500hz, no response shaping.
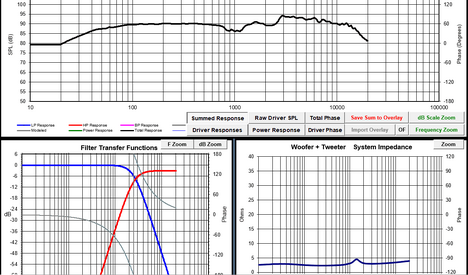
You can see there isn't enough cut on the tweeter and the response is a little uneven. Notice the transfer function in the lower left corner. Good overlap there, looks like a good fit, but the response isn't good.
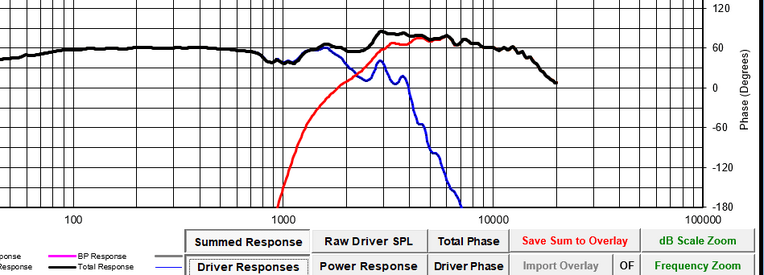
There is the drive responses overlayed to try to show whats going on. Clearly we have some driver response problems to tame. However, what I really wanted you to see what that open area between the black line and the red and blue driver lines. This is the point where the drivers are constructively adding on each other, if you will. If it really was just the sum of its parts, the response wouldn't look like that, it would dip down where the drivers dip down.
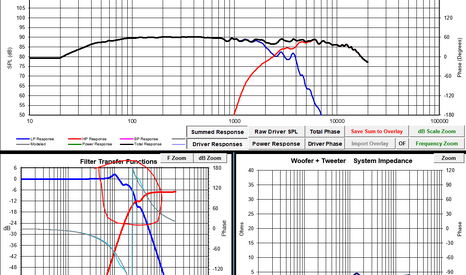
Look at that, much better right? Look at the transfer function now. It's been carefully shaped to flatten the driver response. I did this by adding more cut and adding in a bunch of PEQ filters.
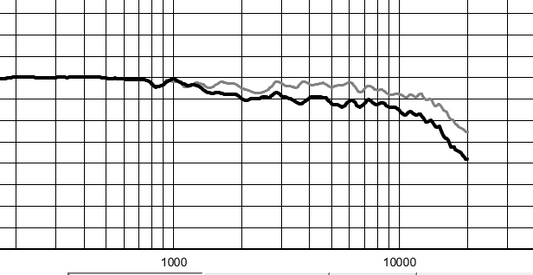
Problem though, we never looked at the response at different angles. Once we look at 0 degrees and 30 degrees, we see some minor issues. First, the response is rolling off a lot in the very high frequencies and second, that the response isn't quite the shape we would want off axis. it's too flat out to 1khz.
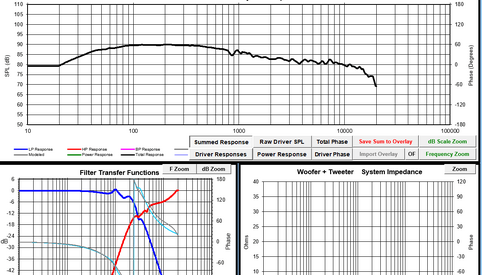
In fact, by this point you want to start looking at hwat is going on at 45 degrees to make sure the response out to 45 degrees has the falling shape you want. As you can see, by adding some more PEQ, the transfer function looks very wacky, but the actual speaker response looks good for 45 degrees.
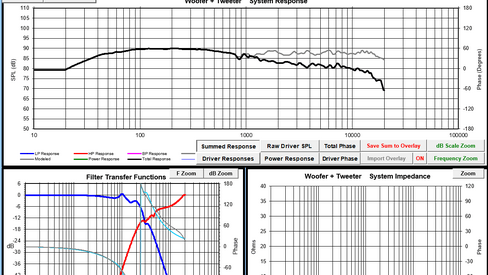
Now we look at 0 and 45 degrees and we see the response looks good through that range. We see that I actually made a flatness compromise on the axial response to ensure the off-axis response was smoother. This is why its so important to look at the polar data.
What do the filters look like to achieve that?
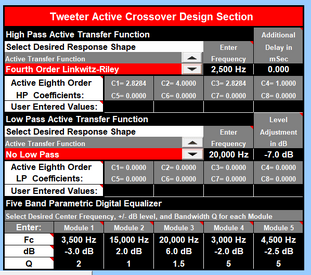
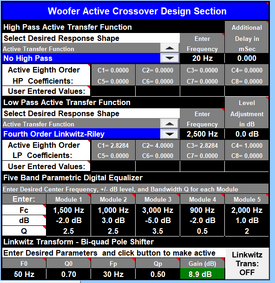
There is the woofer and tweeter filters. High and low pass plus PEQ to adjust. I didn't do any time delay in this, but in practice, you would also need to look at delay.


