Speaker Impedance measurement ,circuit and sound card output

John Mulcahy

REW Author
Joined
Apr 3, 2017
Posts
8,183
If you look at the plot of simulated impedance versus measured impedance for the added mass measurements you will see whether the fit is good, with accurate masses and good measurement the simulation is a very close match to the measurement. If there are significant differences in the position and height of the peak that suggests the mass figures are incorrect. A more accurate scale is a good idea.
 

icbcodc

New Member
Thread Starter
Joined
Apr 29, 2020
Posts
187
If you look at the plot of simulated impedance versus measured impedance for the added mass measurements you will see whether the fit is good, with accurate masses and good measurement the simulation is a very close match to the measurement. If there are significant differences in the position and height of the peak that suggests the mass figures are incorrect. A more accurate scale is a good idea.

I notice there are two peaks in the no mass measurement plot.

32368


there are two small peaks in the 7.1g mass measurement plot.

32369


two tiny peaks in 14.1g measurement plot.

32370


I will buy a new scale with 0.01g acuracy,and run the measurement again.
 

John Mulcahy

REW Author
Joined
Apr 3, 2017
Posts
8,183
Those are typical minor cone resonances, nothing to worry about. I was meaning differences like this for the 14g measurement previously posted with a dual added mass fit:

32372


Doing single-added mass provides a good fit, but the fit parameters are different for the 7g measurement, which suggests it is the mass values which are not correct.

32373
 

icbcodc

New Member
Thread Starter
Joined
Apr 29, 2020
Posts
187
Those are typical minor cone resonances, nothing to worry about. I was meaning differences like this for the 14g measurement previously posted with a dual added mass fit:

View attachment 32372

Doing single-added mass provides a good fit, but the fit parameters are different for the 7g measurement, which suggests it is the mass values which are not correct.

View attachment 32373

Yes, the value of the mass on my sacle is always changing in around 0.2g range each time I put the mass on the scale。

I just use the value displayed most frequently, so I have to try many times.

I have just bought 3 scales with 0.01g acuracy half an hour ago online, price from 7 dollars to 50 dollars, I will choose the best one or refund for all in 7 days. :cool:
 

icbcodc

New Member
Thread Starter
Joined
Apr 29, 2020
Posts
187
Those are typical minor cone resonances, nothing to worry about. I was meaning differences like this for the 14g measurement previously posted with a dual added mass fit:

View attachment 32372

Doing single-added mass provides a good fit, but the fit parameters are different for the 7g measurement, which suggests it is the mass values which are not correct.

View attachment 32373

Hello, John

First new scale is received.

I realize the simulation and measurement last time didn't provide a good fit.

32440


T/S parameters last time:

32443


This time, I use this new scale, 0.01g accuracy (around 8 dollors).

Simulation in the plot seems better.

32441


BTW, Can I use this way to confirm whether the scale is accurate enough?

New T/S parameters:

32442
 

John Mulcahy

REW Author
Joined
Apr 3, 2017
Posts
8,183
The accuracy of the fit is probably a good indicator. You should check the fit for the added mass measurements, particularly around the peak.
 

icbcodc

New Member
Thread Starter
Joined
Apr 29, 2020
Posts
187
The accuracy of the fit is probably a good indicator. You should check the fit for the added mass measurements, particularly around the peak.

With more mass, the peaks fit worse.

No mass

32444


with 7.00g mass, not fit clearly at the peak.

32445


with 14.02g mass, NOT FIT.

32446
 

John Mulcahy

REW Author
Joined
Apr 3, 2017
Posts
8,183
Those look better than the original measurements, but worth seeing if the other scales give better results.
 

icbcodc

New Member
Thread Starter
Joined
Apr 29, 2020
Posts
187
Those look better than the original measurements, but worth seeing if the other scales give better results.

Hello John,
I used my new scale for a few hours and found it's a bit more accurate scale than the cheaper one,but this more expensive scale (around 50 dollars) did not cause a more accurate simulation.

32462


32463


32464


32465


32466


32467


I'm disappointed by this scale.

T-S parameters:

32468


BTW, is the simulation plot calculated only at the first time when I'm calculating the T-S parameters?
 

Breeman

Member
Joined
Jan 9, 2019
Posts
188
Not to distract from the essence of this topic. I would suggest to try simulate the box responses based on both sets of T/S parameters to see if the differencies are noticeable. It may be that the differencies are not really worth all the effort to improve the accuracy of the T/S parameters in case they are in the ball-park already. Just my 2 cents.
 

John Mulcahy

REW Author
Joined
Apr 3, 2017
Posts
8,183
It is probably best to make one set of measurements, noting which masses were used, then measure those masses on the different scales and see which set of mass figures gives the best results for that measurement. There will be variations between measurements, so sticking with one measurement reduces the variables. Breeman's advice is good though, make sure the variations in the resulting parameters are sufficient to be worth the effort of trying to increase the accuracy.
 

icbcodc

New Member
Thread Starter
Joined
Apr 29, 2020
Posts
187
Not to distract from the essence of this topic. I would suggest to try simulate the box responses based on both sets of T/S parameters to see if the differencies are noticeable. It may be that the differencies are not really worth all the effort to improve the accuracy of the T/S parameters in case they are in the ball-park already. Just my 2 cents.

Hi Breeman
Thank you for your advice, it is a good way.

I 'm trying to use WINISD(latest version can be downloaded here) cause it's simple, do you recommend any other enclosure simulating software?

I will start the test from the T-S parameters in my POST 63 using cheapest scale.

This is the T-S parameter I post before in POST 63, FYI.

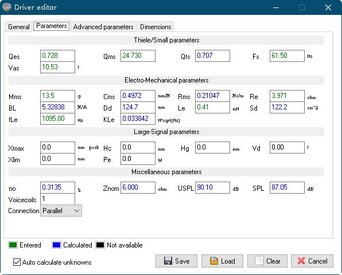
32513


32514


WinISD will caculate some values in colar blue,this assistant function is recommended by it. I checked the blue values, their corresponding values in REW T/S parameters are almost same.

Some values are not available, I just leave them blank.

32515


32516


Not measured speaker, just leave it blank.

32517


I saved the parameters.

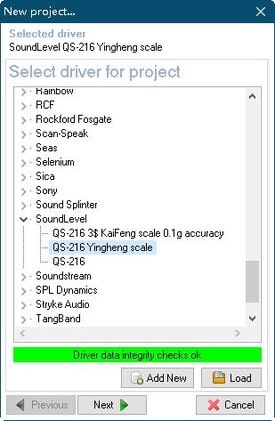
When I selected it for box simuation I found an error message. Does it matter?

32518


Simulated enclosure VOLUME 11.75, QTC 0.971

32521
 

Attachments

  • 08another integrity checks ok.jpg
    08another integrity checks ok.jpg
    29.9 KB · Views: 11
Last edited:

icbcodc

New Member
Thread Starter
Joined
Apr 29, 2020
Posts
187
Not to distract from the essence of this topic. I would suggest to try simulate the box responses based on both sets of T/S parameters to see if the differencies are noticeable. It may be that the differencies are not really worth all the effort to improve the accuracy of the T/S parameters in case they are in the ball-park already. Just my 2 cents.

Second scale is Kubei 0.01g accuracy, price around 8 dollars.

T-S parameters according to New T/S parameters in POST 80

32522


Creat New Driver with T-S parameters:

32523


32525


32526


32527


Enclosure simulation project creating:
This time, T/S parameter integrity checks ok.

32528


32529


Select closed box. EBP 84.5

32530


Everytime I use "1.000" for different project to compare.

32531


Box volume: 11.29L , QTC 0.971

3 dollars scale and 8 dollars scale in closed box simulation make no difference.

32533
 

Attachments

  • Snap2.jpg
    Snap2.jpg
    48.6 KB · Views: 9
Last edited:

icbcodc

New Member
Thread Starter
Joined
Apr 29, 2020
Posts
187
Not to distract from the essence of this topic. I would suggest to try simulate the box responses based on both sets of T/S parameters to see if the differencies are noticeable. It may be that the differencies are not really worth all the effort to improve the accuracy of the T/S parameters in case they are in the ball-park already. Just my 2 cents.

Now use the T-S parameters created by the disapointed scale (50 dollars,brand Yiheng) to simulate the closed box.

T/S parameters come from POST #84, the lastest impedance measurement yesterday.

32540


T-S parameters input:

32541


32542


32543


32544


Closed box simulation, new project:

32545


32546


32547


32548


Box volume: 36.75L (totally different) , QTC 0.986

3 dollars scale and 8 dollars scale in closed box simulation make no difference. but 50$ scale makes big different.

So which one is correct simulation? maybe the cheap scales are better?

32549
 

icbcodc

New Member
Thread Starter
Joined
Apr 29, 2020
Posts
187
It is probably best to make one set of measurements, noting which masses were used, then measure those masses on the different scales and see which set of mass figures gives the best results for that measurement. There will be variations between measurements, so sticking with one measurement reduces the variables. Breeman's advice is good though, make sure the variations in the resulting parameters are sufficient to be worth the effort of trying to increase the accuracy.

Hi John

I made the mass into four pieces, and divided them into two groups, group one including all mass for one measurement, group two including only 2 pieces of mass for the other measurement.

First, I did three measurements, and input the mass value get from Ying heng scale (price 50$), it looks like a more accurate scale.

mass one : 7.01g
mass two : 14.01g

No warning message.

32599


But the simulation is bad with 14g mass

32600


it looks not too bad for 7g mass simulation.

32601


It looks perfect no mass added.

32604


group one mass 7.01g

32602


group two mass 7.00 , used with group one together running measurement.

32603


32605


7.01g mass is put left and right, this is also for 7.01g measurement.

7.00g mass is put up and down

7.01g mass get 7.00g number on KUBEI scale(cheaper one).

32606


7.00g mass get 7.01g number on Kubei scale(cheaper one)
32607


the saddest thing is the value keep going down.

32608


32609


32610


I know this KUBEI scale is not accurate like the expensive one.

But the expensive one looks good,but the simulation result is bad.

I'm frustrated,anything wrong? Should I calibrate the rig each time before I measure the impedance?

Is it possible the enviroment for measurement is too noisy?
 
Last edited:

John Mulcahy

REW Author
Joined
Apr 3, 2017
Posts
8,183
Looks like you cannot trust the scale which drifts. It may help to run a sine wave at the sweep level for a period before starting each measurement, to make sure the driver is in the same condition for each run and try and remove any effect of shifting the cone when adding/removing masses. Also try starting the measurements at 10 Hz rather than 20 Hz, so there is a little more data for the curve fit to use.
 

icbcodc

New Member
Thread Starter
Joined
Apr 29, 2020
Posts
187
Looks like you cannot trust the scale which drifts. It may help to run a sine wave at the sweep level for a period before starting each measurement, to make sure the driver is in the same condition for each run and try and remove any effect of shifting the cone when adding/removing masses. Also try starting the measurements at 10 Hz rather than 20 Hz, so there is a little more data for the curve fit to use.
I tried again from 10hz to 20000hz and added a sweep before each measurement.

But the result is still not very good.

32611


perfect simulation when no mass

32612


Not that good 7.02g mass

32613


Bad result.

32614


I double check the mass after I get it down from the speaker, I believe the weight value is accurate, but the simulation result with more mass is worse.

Something still wrong ?
 

John Mulcahy

REW Author
Joined
Apr 3, 2017
Posts
8,183
The measured phase looks odd on the 14g measurement, I wonder if the added mass is still a little too much, or perhaps the masses were not quite symmetric? Worth trying with smaller masses.
 

icbcodc

New Member
Thread Starter
Joined
Apr 29, 2020
Posts
187
The measured phase looks odd on the 14g measurement, I wonder if the added mass is still a little too much, or perhaps the masses were not quite symmetric? Worth trying with smaller masses.

I think they are symmetric on the speaker cone.

32620


and each piece is around 3.51g。

32621


I'm preparing to use 80% of MMS as first mass, and 64% of MMS as second mass, is that O.K.?
 

icbcodc

New Member
Thread Starter
Joined
Apr 29, 2020
Posts
187
Why not make a big step to 50% and 25% and see what difference that makes?

I'm reading the manual made by Jeff Candy and Claus Futtrup, and try their online app using their sample data, because I want to find some clue about the relation between MMS and Added Mass qulity.

I download the sample measurement files from the the MANUAL page, and generated a json file needed later in the COLLECT page and download the json file.

and upload the json file in FIT page, calculating automatically and pass.

There are some errors but still pass.

32623


The MMS of the speaker is around 14.8959g

32624


You can see the first mass is 8.017g, the second one is 16.048g, and 16.048g > 14.8959 (Mms)

32625


Zoom in the impedance plot, at the peaks, the simulation is also bad when added mass is 16.048g.

It's not better than the simulation in REW.

I'm not sure whether this is caused by the mass quality which is larger than Mms.

32626
 

Bernard

Member
Joined
May 22, 2017
Posts
121
I'm reading the manual made by Jeff Candy and Claus Futtrup, and try their online app using their sample data, because I want to find some clue about the relation between MMS and Added Mass qulity.

I download the sample measurement files from the the MANUAL page, and generated a json file needed later in the COLLECT page and download the json file.

and upload the json file in FIT page, calculating automatically and pass.

There are some errors but still pass.

View attachment 32623

The MMS of the speaker is around 14.8959g

View attachment 32624

You can see the first mass is 8.017g, the second one is 16.048g, and 16.048g > 14.8959 (Mms)

View attachment 32625

Zoom in the impedance plot, at the peaks, the simulation is also bad when added mass is 16.048g.

It's not better than the simulation in REW.

I'm not sure whether this is caused by the mass quality which is larger than Mms.

View attachment 32626
Something's wrong. Your quality analysis is the same as the Seas driver.
Can you send your 3 impedance measurement mdat files ?
 

icbcodc

New Member
Thread Starter
Joined
Apr 29, 2020
Posts
187
Something's wrong. Your quality analysis is the same as the Seas driver.
Can you send your 3 impedance measurement mdat files ?

There isn't any mdat file. I didn't do any measurement in POST 96.

Because in POST 96, I JUST downloaded and uploaded the sample measurement files provided by "speakerbench" and then generated online T/S parameters and simulation plot.
 

Bernard

Member
Joined
May 22, 2017
Posts
121
There isn't any mdat file. I didn't do any measurement in POST 96.

Because in POST 96, I JUST downloaded and uploaded the sample measurement files provided by "speakerbench" and then generated online T/S parameters and simulation plot.

There's a misunderstanding.

The first step is to create a first ZMA file from your existing MDAT file with the mass of 0 g,
then a second ZMA file from your existing MDAT file with the mass of 7 g,
and finally a third ZMA file from your existing MDAT file with the mass of 14 g.

The second step is to upload your 3 ZMA files into the site Speakerbench using the Collect tab. Speakerbench will create your JSON file from your data, named Zyyyymmdd_hhmmss.JSON .

The third and last step is to use this personal JSON file to get the quality fit report.
If you are unable to create the ZMA files, attach the mdat files with the 3 weights.
 

John Mulcahy

REW Author
Joined
Apr 3, 2017
Posts
8,183
He was just trying with the sample data first to see how it behaved.

Although the peak heights with the sample data aren't an exact match the measured and simulated responses are quite well aligned in frequency. I did discuss the fit with Claus and Jeff while implementing the dual added mass method, whilst the Ritter 3PC model does a good job of modelling the frequency dependence of compliance there remain other aspects of the driver's behaviour that aren't reflected in the model, hence the less than perfect fit. It is nonetheless much better than the basic TS model.
 
Top Bottom