FSAF (Fast subband adaptive filtering) measurement

Tikkidy

New Member
Joined
Feb 22, 2019
Messages
29
Weren't you just measuring a loopback on an interface? I think sm52 was measuring a loudspeaker.


Can you email me an example FLAC it doesn't like? feedback@roomeqwizard.com.


As above, use email.
Hi John,

I will await a response from Stephane as this is his IP.

I have been able to confirm, however, is that it is not unique to that file. As a test I manually converted another 20 second audio clip from 16 bit stereo 44.1KHz WAV format to FLAC, and the error message from REW is that it is only 10 second duration, and thus unusable.

Of course the workaround is the use original WAV, or a longer music sample.
It just so happens that the sample clip from Audiocheck.net is a good example a music clip with full frequency and good dynamic range, containing instruments and vocals, AND is available on the web- perhaps others may be able to use as well.

In the meantime, I’m going back up a bit, remove the audio interface, and test with a virtual cable how REW’s SBAF performs in comparison the exponential sine sweep,
 

John Mulcahy

REW Author
Thread Starter
Joined
Apr 3, 2017
Messages
7,844
As a test I manually converted another 20 second audio clip from 16 bit stereo 44.1KHz WAV format to FLAC, and the error message from REW is that it is only 10 second duration, and thus unusable.
So can you email me that file?
 

Tikkidy

New Member
Joined
Feb 22, 2019
Messages
29
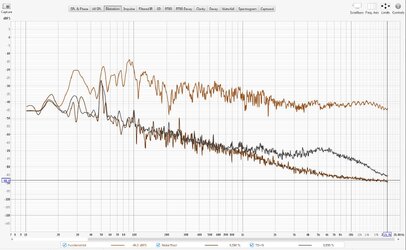
FSAF using a Virtual Audio Device in WASAPI Exclusive mode. Stimulus is white noise, duration of 60 secs, level -15dBFS
(NB. pink noise and brown noise show the same result (not graphed)

1721512175031.png

Another view:
1721512692984.png


How does FSAF test compare to the (exponential sine) Sweep?
This is from Settings -> Calibrate soundcard @-12dBFS

This is a sweep of 256K samples when testing from 10Hz to 22.050KHz, fast- only 6 seconds.
1720868081555.png

The highest line is THD which incorporates H2 to H9, from about -130dB to -110dB.

What about using a longer sweep- this time 1M samples - this test duration~24 seconds
1720868096675.png

It looks similar, but is actually a little cleaner.

What about a sweep with 4M samples? (this test duration: 95 seconds)
1720870538098.png

Yes, the longer length is certainly more resolving, as discussed in the REW manual.

edit: Updated. measurements with WASAPI drivers.
 
Last edited:

Tikkidy

New Member
Joined
Feb 22, 2019
Messages
29
Speakers?

Not yet.

I’m working through each part of the chain: That part was just the internal chain.
(a 24 bit internal virtual cable (i.e. no DACs, amps, speakers, microphones, ADCs involved)

Now I insert the DAC/ADC... then I will insert my amp, after that I will insert my mic and speaker.
1720905356028.png
 

Tikkidy

New Member
Joined
Feb 22, 2019
Messages
29
Now I insert the amp and play the audio track that would not clip the input:

1720937654351.png


This is the result when testing with the white noise
1720937250942.png


Interesting, but perplexing!
 

John Mulcahy

REW Author
Thread Starter
Joined
Apr 3, 2017
Messages
7,844
All testing here done at -12 dBFS (to avoid clipping signal path with a short musical track), with a 24 bit internal virtual cable (i.e. no DACs, amps, speakers, microphones, ADCs involved) at 44.1KHz sample rate.(to avoid resampling)
Using a dBr (or other relative axis) with the music track gives a misleading result, since the varying spectrum of the track will mean the TD+N result and noise floor will vary inversely as everything is relative to the track's content. Better to use an absolute axis setting such as dBFS.
 

John Mulcahy

REW Author
Thread Starter
Joined
Apr 3, 2017
Messages
7,844
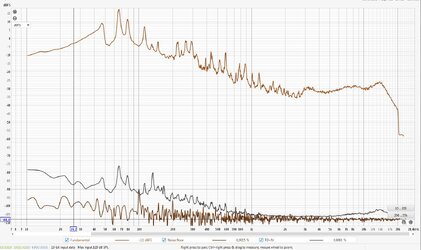
Looks pretty typical. Noise floor seems a little high. Here's an old, 16-bit interface tested using an analog loopback with a 20 s segment of "Closer" (Kings of Leon):

1721125975025.png
 

sm52

Member
Joined
Mar 14, 2019
Messages
979
It turns out that FSAF measurement should always be carried out with a loopback. Do I get it right?
 

Tikkidy

New Member
Joined
Feb 22, 2019
Messages
29
The reason I’m doing loopback in stages is a sanity test that check that everything is working as is, before moving to the next,
But you don’t have to.

Speakers in rooms coming!
 

sm52

Member
Joined
Mar 14, 2019
Messages
979
Looking at my and your measurements. Your signal level is 30 dB higher and the distortion level is 20 dB lower. You have a horizontal line of noise and distortion levels, and I have an inclined line. Is it because you have white noise and I have pink noise?
 

Attachments

  • FSAF.JPG
    FSAF.JPG
    245.6 KB · Views: 14

John Mulcahy

REW Author
Thread Starter
Joined
Apr 3, 2017
Messages
7,844
Looking at my and your measurements. Your signal level is 30 dB higher and the distortion level is 20 dB lower. You have a horizontal line of noise and distortion levels, and I have an inclined line. Is it because you have white noise and I have pink noise?
My measurement was with a music file. The noise floor shape difference is because I measured a loopback connection on a soundcard, not a loudspeaker. The soundcard has a flat noise spectrum. Electret mics have a noise spectrum that rises below about 8 kHz, room noise also rises at lower frequencies.
 

John Mulcahy

REW Author
Thread Starter
Joined
Apr 3, 2017
Messages
7,844
There's nothing to show, it's one connection from output to input. Just like a loopback calibration measurement.
 

sm52

Member
Joined
Mar 14, 2019
Messages
979
Then it turns out that when using a loopback on a sound card, the distortion is much less. Although objectively they cannot be more or less on the same equipment and in the same room on the same music track. Ok. I'll try it myself.
 

John Mulcahy

REW Author
Thread Starter
Joined
Apr 3, 2017
Messages
7,844
Then it turns out that when using a loopback on a sound card, the distortion is much less. Although objectively they cannot be more or less on the same equipment and in the same room on the same music track. Ok. I'll try it myself.
I think you misunderstand. Those are measurements of the loopback, not measurements of equipment.
 

sm52

Member
Joined
Mar 14, 2019
Messages
979
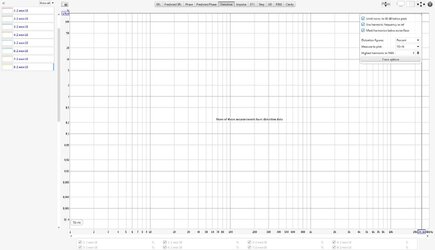
I have 7 measurements. When I go to the overlays window for the first time after measurements, there are no distortion graphs. Until I click on any measurement on the left.
 

Attachments

  • FSAF2.JPG
    FSAF2.JPG
    124.5 KB · Views: 12

sm52

Member
Joined
Mar 14, 2019
Messages
979
Those are measurements of the loopback,
Then my levels are normal.

I noticed that the same music track used for FSAF measurement can have different k-factors. I cannot indicate the difference in measurement conditions, there was no goal to find out, but in one case it was 3.2, in another 4.52, in others there were some values in between. Shouldn't the same music track have the same characteristics?
 

Attachments

  • FSAF3.JPG
    FSAF3.JPG
    237.1 KB · Views: 11

John Mulcahy

REW Author
Thread Starter
Joined
Apr 3, 2017
Messages
7,844
I noticed that the same music track used for FSAF measurement can have different k-factors
The kurtosis is calculated from the data used as the stimulus. If the file segment start time or length are changed the kurtosis is likely to change. If the sample rate changes the data will be resampled to the new rate if it is different from the file rate and again the kurtosis may change. If filters are used to limit the signal bandwidth that also changes the data and hence the kurtosis.
 
Top Bottom