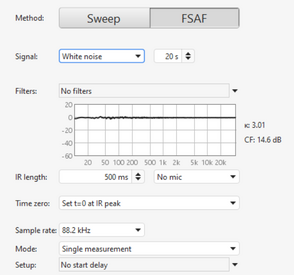
FSAF (Fast subband adaptive filtering) measurement

John Mulcahy

REW Author
Thread Starter
Joined
Apr 3, 2017
Posts
8,052
I took FSAF, acoustic, and regular sweep measurements. Distortion levels differ by a factor of 10.
There are several differences.
  • The stimulus is not the same
  • Sweeps have low crest factor (the peak is only 3 dB above the rms level) so for a given rms level the signal peaks are much lower than for noise or music signals. As distortion is level-dependent that means lower distortion for a given rms signal level
  • Sweeps measures harmonic distortion and THD, FSAF measures TD+N and so includes both harmonic distortion and intermodulation
Increasing signal level will initially improve signal-to-noise ratio as the signal increases but the noise does not, until the increased signal level brings distortion above the noise.
 

sm52

Member
Joined
Mar 14, 2019
Posts
1,009
Thanks for answers. I have attached the measurements. Why does REW determine the peak time of the impulse of the FSAF measurements differently?
 

Attachments

  • FSAF 2.mdat
    14 MB · Views: 58

John Mulcahy

REW Author
Thread Starter
Joined
Apr 3, 2017
Posts
8,052
Noise floor looks high. Since input and output are on the same interface you don't need to use timing markers.

Why does REW determine the peak time of the impulse of the FSAF measurements differently?
I'm not sure what is happening with the file measurements. Does the track start quietly? REW may be struggling to correlate the track start with the incoming data, you can pick a start time further into the track where it has good levels to see if that helps.
 

Tikkidy

New Member
Joined
Feb 22, 2019
Posts
40
Dear John,

I note closer.wav in your help file... Can you suggest any reference clips so we can test that everything is working as it should, before proceeding with acoustic measurements?

eg. soundcard loopback, ASIO drivers, 16bit 44.1KHz loopback, -30dB. Pink noise, or open source royalty free music clip.

I have a stable installation of REW, and will install the Beta on another machine, run the pink noise FSAF measurement and post back my result later...
 
Last edited:

John Mulcahy

REW Author
Thread Starter
Joined
Apr 3, 2017
Posts
8,052
To validate use white or pink noise, white is fine for soundcard loopback.
 

sm52

Member
Joined
Mar 14, 2019
Posts
1,009
John, I have one spl graph from a res- file loaded in the distortion window using the 'load FSAF residual' button, and a second spl graph of the same res- file loaded through the RTA window. Should they be the same?
 

John Mulcahy

REW Author
Thread Starter
Joined
Apr 3, 2017
Posts
8,052
As we have discussed previously, the result of an average of a series of short FFTs of a sequence (RTA processing) is likely differ from a single FFT of the whole sequence (importing audio data).
 

sm52

Member
Joined
Mar 14, 2019
Posts
1,009
The difference was about 35 dB. I expected a lot less. Another difference is that the LF levels differ less, the HF levels differ more.
 

Tikkidy

New Member
Joined
Feb 22, 2019
Posts
40
All tests below are loopback testing of Focusrite 2i2(3rd gen) with a 1/4" TRS cable from Output 1 to Input 1 (loopback) mode.

First the obligatory checks to make sure everything is working: 88.2KHz sample rate:
1720074335863.png


Here's the distortion:
1720073787052.png


Increasing the sample size and number of repetitions in Measure mode (Sweep length 4M samples, 8 repetitions)
1720073834650.png


Now switching to FSAF mode. Here are my settings:
1720074510807.png

1720073987143.png
Next- pink noise:
1720073943654.png


Finally the Custom Musical Track from https://www.audiocheck.net (scroll down to near the bottom of this page, and click the play/pause icon to hear this music clip directly in your browser)

1720074119209.png


It's a challenge to see what to make of this. So here's another view:
1720074847499.png


What can you make of this?
@dcibel @John Mulcahy
 
Last edited:

John Mulcahy

REW Author
Thread Starter
Joined
Apr 3, 2017
Posts
8,052
Try the music track at a lower level, e.g. -20 dBFS, to see how that looks.
 

Tikkidy

New Member
Joined
Feb 22, 2019
Posts
40
Any particular reason John? Did you think there may have been some clipping at -14dBFS?

Here tis, again:


1720091812519.png


1720091967929.png
 

John Mulcahy

REW Author
Thread Starter
Joined
Apr 3, 2017
Posts
8,052
Any particular reason John?
If the TD+N is due to the interface reducing the level should lower the TD+N by more than the level reduction. If it doesn't there may be some stimulus characteristic causing issues, such as clipping or inter-sample overs in the track.
 

Tikkidy

New Member
Joined
Feb 22, 2019
Posts
40
Right.

So now, how to interpret the graph?

why is there a widening gap at the extremes of frequencies? (See figure below- denoted in blue at 20Hz and 20KHz)

IMG_1282.jpeg


Can anyone else share screenshots of what they are seeing?
 

Tikkidy

New Member
Joined
Feb 22, 2019
Posts
40
By stimulus, do you mean the music file? I will have to ask Stéphane who runs www.audiocheck.net if he will release it for educational use.


@sm52 's .mdat file shows significantly more distortion- I'm not sure what your setup/settings are, and what music clip you use (if any). Please advise.
 

sm52

Member
Joined
Mar 14, 2019
Posts
1,009

Tikkidy

Any music file can be used. Mine has silence at the beginning, so timing the peak of the impulse is not very accurate. As I understand it, FSAF allows you to get a picture of how your audio system works on music material. Not on a sweep. That is, as truthfully as possible. The difference between your distortion graph and mine is in the Y axis. For you it is SPL, for me it is %.
 

John Mulcahy

REW Author
Thread Starter
Joined
Apr 3, 2017
Posts
8,052
Mine has silence at the beginning, so timing the peak of the impulse is not very accurate.
Note that you can change the start time of the segment REW uses to skip the silence or quiet parts.
 

Tikkidy

New Member
Joined
Feb 22, 2019
Posts
40
@sm52 distortion values are MUCH higher than mine. I’m curious to what settings he’s using. Or what music stimulus he’s using.

I’m aware I can send any music file through it, though it doesn’t like my FLAC for some reason- with an error saying it was less than 20 seconds when it wasn’t. Never mind, I sent the WAV equivalent and it was OK.

Thanks for the offer John. I’ll wait to hear from Stephane first. I had to use a workaround to “grab” the audio clip from his website. And then how to send the file to you- the other attachment was blocked.
 

John Mulcahy

REW Author
Thread Starter
Joined
Apr 3, 2017
Posts
8,052

Tikkidy

New Member
Joined
Feb 22, 2019
Posts
40
Agree John. That’s why I’m measuring each step of the chain to verify what is going on before doing a complete loop.

@sm52

Are you able to outline your measurement setup from output to input, including audio interface or DAC, amplifier, speaker, measurement distance, microphone, ADC.

And test signal/music clip? Apologies if that has previously been mentioned in this post or .mdat file.
 
Last edited:

sm52

Member
Joined
Mar 14, 2019
Posts
1,009
USB laptop -> external sound card Audient id14 -> its linear output -> amplifier Hegel h90 -> speakers Audiovector qr5 -> microphone audiosystem -> its preamplifier -> microphone input Audient id14.
 

Attachments

  • FSAF sample.zip
    1.6 MB · Views: 94

Tikkidy

New Member
Joined
Feb 22, 2019
Posts
40
Thank you. What SPL is observed at the microphone? And what microphone system are you using?
 

sm52

Member
Joined
Mar 14, 2019
Posts
1,009
I don't remember the mic input scale reading. This is a condenser microphone. It was located at a height slightly higher than the tweeter, from 1m to 1.18m at different distances from the speaker.
Since you have the same stimulus fragment as I do, you could make measurements with it in your conditions and post it here.
 
Top Bottom