Thanks for taking the time to analyze my measurements. I must apologize, a few sentences into this explanation gets over my head a bit.
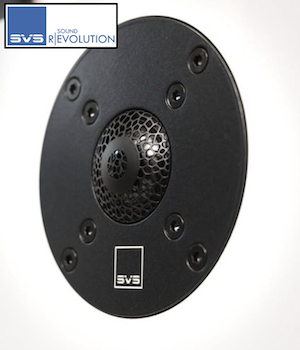
This is exactly my problem, see past few pages of this thread. This Speaker is a Satori MW16P and a 28mm hard dome tweeter in a shallow waveguide. The speaker is of my own design, and crossover is at ~2kHz.
I had lengthy response written up as I completed testing this evening, including measuring at 1cm to prove a point that the variation had little to do with the room and background noise. However, I'll cut to the chase - the variance here is caused by myself, and I believe I've determined the cause. It's my own test jig.
A simple jig that I use for testing all my speakers, when set up for "SPL" measurements, the signal simply runs through a switch - an industrial style rocker switch rated at 15A. It's provided perfectly good repeatability and consistency for my all my measurements in the past - ESS, HD, IMD, MLS, periodic noise, you name it, and I've just made a habit of leaving it in place for all my measurements whether I need it or not, and didn't even think to remove it in all my troubleshooting. Somehow this FSAF was doing something special, at seemingly random intervals. I have to think that the switch contact is not as good as it could be. Stupid me connected the amp straight to the speaker, and low and behold, the situation is much improved. I tested 2 different speakers to be sure.


