V5.20.14 early access build

Status
Not open for further replies.
PLEASE IGNORE THE ABOVE: [FDW] was stuck with L for some reason, it's not supposed to show FDW situation in the drop down list!!!
Correct, but it has highlighted a bug which is the annotations appearing in the measurement name panels. They should only show the unannotated measurement title.
 
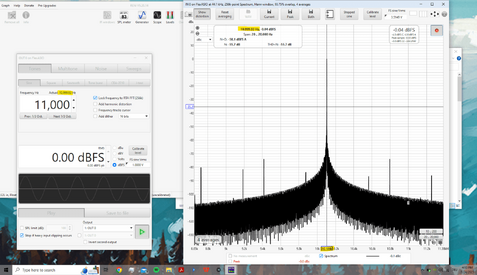
Today I measured a poor DDC chain using V5.20.14:
Screenshot 2023-01-24 1613542.png
As you can see, it turned an 11k sine at 44.1k Fs into 10.1k (can only handle 48k Fs and multiples properly).
What threw me off though is that the distortion box in the RTA Window still shows the generated frequency, not the measured one.
Could this be changed to reflect the actual input?
 
If the REW generator is the source its frequency is used as the fundamental, otherwise the fundamental is determined from the input.
 
is there a way to force REW to determine the fundamental from the input, even if REW generator is the source?
 
Afraid not. I could add a distortion setting to ignore the generator frequency and only use the frequency of the largest input peak, but that can go wrong if distortion creates an asymmetric peak causing an error in the fundamental frequency estimate. There would also need to be some checks and a warning somewhere if the input frequency peak didn't correspond to the generator frequency. Perhaps an option would be just to warn if the input peak is not at the generator frequency.
 
Builds updated today with these changes:
  • Added: Show a warning if the measurement and loopback input or output selections are the same when using a loopback as timing reference
  • Changed: The maximum clock adjustment has been reduced to 400 ppm, adjustments larger than 200 ppm are likely to be due to dropouts or other measurement issues
  • Fixed: Annotations (such as [FDW]) could appear in the measurement panel names
 
Dear John,

In the latest version (ea28), copying AllSPL selections to Overlays doesn't update Overlays window immediately. Overlays is open on my second monitor and I need to click tabs on Overlays for the AllSPL selections to update. I don't think older version had that problem.
 
Builds updated today with these changes:
  • Added: Hypex Input EQ equaliser entry
  • Added: "Iron" colour scheme for spectrograms and waterfalls
  • Changed: EQ filter frequency spinners accept k after the figure to denote kHz, e.g. entering 1.5k will set the frequency to 1.5 kHz
  • Fixed: Copying All SPL selections to other overlay graphs did not immediately update the current overlay graph
  • Fixed: Using loopback cal as ref could fail in some circumstances
 
Builds updated today with these changes:
  • Added: pipeline entry in CamillaDSP YAML file that lists the filter names
  • Added: There is now a V/sqrt(Hz) axis option for the All SPL graph, but only RTA spectrum measurements have valid V/sqrt(Hz) data
  • Added: The Equaliser preferences now include a setting for the default target level
  • Changed: When the V/sqrt(Hz) axis option is chosen only show V/sqrt(Hz) in the legend units if the measurement has a valid Amplitude Spectral Density value, otherwise show volts as the unit
  • Fixed: RTA distortion panel N figure read low when the fundamental was close to the noise floor
  • Fixed: UMIK-1 with USB-C connections and no volume control adjustment in Audio Midi Setup could read 3 dB high on macOS
 
Builds updated today with these changes:
  • Added: Show a warning if the SPL offset is changed but the Y axis is not SPL
  • Changed: Only scale up icons for retina screens if all the attached displays are retina
  • Fixed: The configurable equaliser class definition had an error that meant it became incompatible with earlier builds in ea29, preventing mdat files saved by ea28 and earlier that used a configurable equaliser from loading. The definition has been corrected to be compatible with the ea28 and earlier builds but that makes it incompatible with the ea29 and ea30 builds. A workaround for those is to load the file in ea30, change to another equaliser then save it again.
 
Thanks John.

Since you mentioned SPL offset, I have a suggestion: Can some note be added to the measurements involved in an "Align SPL" command showing individual SPL offsets applied? Currrently producing response copies and aligning them first and then comparing with the originals is the only way to extract that information.
It is shown as "Align offset" in the Info panel for each measurement. It is a cumulative offset, showing the difference to the original measurement level before any alignment was done.
 
Yes, just checked it. Thanks for the tip!
 
Possibly stupid question but shouldn't these measurements match?

PN noise from 200-2000Hz BU4 at -12dBFS, yellow trace is measurement sweep from 200-2000Hz. I have "adjust RTA levels" checked but the measurements are off by 5dB. RTA shows correct SPL level of 80.65dB in top right corner, but actual level shown is 85.5dB.
1676081893312.png
 
They are only likely to match for a full range PN test signal, for narrower bandwidth signals the level over the signal's range will be higher to achieve the desired overall rms level. The RTA appearance offset does not change with signal type or bandwidth, it is only changed to keep the level constant as the RTA octave fraction changes.
 
I understand there may be "math reasons", but to me it looks odd/incorrect to see varying SPL levels with same actual output SPL stimulus. Below are all the same SPL of measurement.
1676138277509.png


Perhaps a smll bug as well, in ALL SPL, selecting "no smoothing" shows 1/48 oct smoothing in the legend.
 
A measurement saved from the RTA is log spaced at 96 PPO, it can't be less smoothed than 1/48 octave (like other log spaced measurements).

The SPL of a signal is a measure of its rms level, a time domain measure. The frequency domain equivalent is the area under the frequency response, the narrower you make that response in the frequency domain the higher the top will have to be to achieve the same rms value.
 
Ok, I think I get it. The periodic PN over full frequency range at 128k creates a noise signal that covers the entire frequency range in 128k samples. When changing this to a band limited signal and the same 128k samples, each band limited frequency is presented with a noise signal for a longer time duration, hence the increased SPL in the frequency domain RTA. This is different than a band limited measurement sweep, which will simply be a shorter duration of sweep, each frequency is still given the same output for the same time duration.

On the 1/48 oct smoothing, the only reason I mention it is that when the initial RTA response is saved, the legend shows no smoothing "----" instead of 1/48 oct.
 
Somewhat. In the band-limited PN the (fewer) constituent frequencies are at a higher level so that the overall rms average meets the desired figure.

A sweep over a narrower band has the same duration as a full range sweep. The result isn't a spectrum though, it is a transfer function (the ratio of the response to the stimulus) and the level the magnitude response is drawn at is representative of the SPL for a tone at the sweep amplitude.
 
Please don't laugh at me, or think that I'm too stupid for this, I like REW, but I only know how to take measurements, anything else might as well be written in Greek, is there a step by step guide on how to understand more features? I'm sure I'll get told to google it, but can't find it
 
Status
Not open for further replies.
Back
Top