REW Beta Release REW API beta releases

Bowkey

Registered
Joined
Jul 1, 2017
Messages
21
Hi John,

Some of the alignment-tool endpoints only seem to work after using the GUI version first.

Example:
- Start REW
- Import 2 sweep measurements
- Set /alignment-tool/mode to "phase"
- Set /alignment-tool/index-a to "1"
- Set /alignment-tool/index-b to "2"
- Set /alignment-tool/command to "Align phase" "Frequency: 85" "resultUrl": ""

All delays in the resulting message are zero.

After manually using (and closing) the alignment tool through the GUI once, the same API commands produce the expected, non-zero, results. Tested with the latest (5.40 beta 31) build.
 

John Mulcahy

REW Author
Thread Starter
Joined
Apr 3, 2017
Messages
7,643
Some of the alignment-tool endpoints only seem to work after using the GUI version first.
Thanks, I've fixed that for the next build. A possible workaround in the meantime is to set the alignment tool mode before importing any measurements.
 

ziggurcat

Registered
Joined
Sep 14, 2019
Messages
15
A few issues I've noticed on the Beta 31 build (one might have been in Beta 30):

While the right-click menu disappearing with the Apple mouse has been addressed (thank you!!!), the issue still occurs when you right click in the Legend box underneath the measurement window (all other right-click windows that I've tested so far do not close when I move my finger on the mouse while it's open)

I have also noticed that when you select the All SPL tab, select a measurement from the left and click the Info up above it does not display the correct measurement information. In my experience so far, it has only displayed the first measurement or last measurement even though neither of them are selected. This might have been a thing in Beta 30, but I never checked.

EDIT: It seems that the info that is displayed when clicking the Info button up top is whatever measurement is selected in the SPL & Phase tab.

One more bug, but I don't know whether this is only present during Beta builds:

1. Open REW
2. Select the Preference wrench
3. Select the View tab
4. Select Default Trace Colors
5. Select any of the coloured dots
6. The following error message appears:

tIdeIUi.jpg


If you close that window without clicking any of the buttons (i.e. Don't Send, Exit REW or Details), and select one of the coloured dots again, the expected functionality occurs.
 
Last edited:

sm52

Member
Joined
Mar 14, 2019
Messages
935

John Mulcahy

I imported a wav file with IR via file/import IR. And the same wav file through the RTA window. Should they be the same in curve shape and level after import?
 

Attachments

  • import.JPG
    import.JPG
    186.4 KB · Views: 12
  • import wav.mdat
    2 MB · Views: 7

sm52

Member
Joined
Mar 14, 2019
Messages
935
When opening and processing a stereo wav file created by the REW generator (also any wav with audio) in the RTA window, indicating the processing of both channels after processing the first channel, an error occurs.
 

Attachments

  • import err.JPG
    import err.JPG
    203 KB · Views: 10
  • java err.txt
    1.4 KB · Views: 6

John Mulcahy

REW Author
Thread Starter
Joined
Apr 3, 2017
Messages
7,643
the issue still occurs when you right click in the Legend box
I have fixed that for the next build. Dismissing popups on mouse wheel events is behaviour that is buried deep in the Java runtime, unfortunately, so overriding it has to happen on a case-by-case basis.

It seems that the info that is displayed when clicking the Info button up top is whatever measurement is selected in the SPL & Phase tab
Correct. On the All SPL and other overlay graphs the selected measurement has a blue bar on the right hand side.

One more bug
I have fixed that for the next build.
 

John Mulcahy

REW Author
Thread Starter
Joined
Apr 3, 2017
Messages
7,643
I imported a wav file with IR via file/import IR. And the same wav file through the RTA window. Should they be the same in curve shape and level after import?
No. Imported impulse responses have the IR windows applied to generate their response. Files dropped on the RTA window are treated as audio data and the whole content is used to generate the response. A similar affect can be achieved using Import Audio Data.
 

sm52

Member
Joined
Mar 14, 2019
Messages
935
Using the RTA window settings, can I achieve the same shape and level as when importing IR?
 

HD MOVIE SOURCE

New Member
Joined
Jun 23, 2021
Messages
41
More  
Preamp, Processor or Receiver
Denon x6500h
Universal / Blu-ray / CD Player
Panasonic UB9000
Was that when working with a combination of a measurement with an IR and one without?
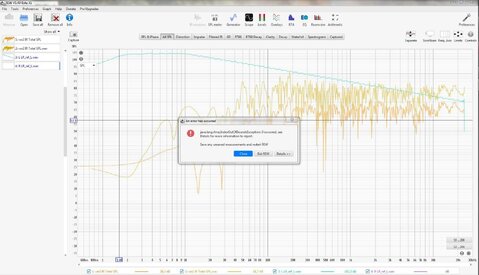
One was a text target curve and the other was a measurement.
 

HD MOVIE SOURCE

New Member
Joined
Jun 23, 2021
Messages
41
More  
Preamp, Processor or Receiver
Denon x6500h
Universal / Blu-ray / CD Player
Panasonic UB9000
Is something like this possible in the export settings? To only use whole numbers with no decimal points?
For example: 12049
instead of now, you might see something like 12049.459000

NEW EXPORT SETTINGS 1.png
 

John Mulcahy

REW Author
Thread Starter
Joined
Apr 3, 2017
Messages
7,643
When opening and processing a stereo wav file created by the REW generator (also any wav with audio) in the RTA window, indicating the processing of both channels after processing the first channel, an error occurs.
I have fixed that for the next build.
 

John Mulcahy

REW Author
Thread Starter
Joined
Apr 3, 2017
Messages
7,643
Using the RTA window settings, can I achieve the same shape and level as when importing IR?
Not usually. An impulse response uses a single FFT of the windowed portion, the RTA uses successive FFTs of the chosen length with the chosen overlap.
 

navid0308

Registered
Joined
Jun 11, 2024
Messages
4
Using the latest beta, when I run rms+phase avg or db+phase avg, the resulting response does not seem to track the combined magnitudes as expected.
1718114521579.png
 

John Mulcahy

REW Author
Thread Starter
Joined
Apr 3, 2017
Messages
7,643
Using the latest beta, when I run rms+phase avg or db+phase avg, the resulting response does not seem to track the combined magnitudes as expected.
It's a problem with the left window width when the imported responses start at zero seconds, i.e. there is nothing at negative time. I have fixed it for the next build, in the meantime manually increase the left window width.
 

sm52

Member
Joined
Mar 14, 2019
Messages
935

John Mulcahy

Thank you for your answers. Recommend a free program that can analyze and accurately generate the levels and shape of a wav sound file.
 

sm52

Member
Joined
Mar 14, 2019
Messages
935
Because you have answered many times to different people that REW is not intended for analyzing audio files with music. I posted two graphs in post 356, hoping that one of them accurately showed the levels and shape of the frequency response, but did not directly ask about it, expecting to read something in your answer. Please tell me now how to get what I want using REW.
 

John Mulcahy

REW Author
Thread Starter
Joined
Apr 3, 2017
Messages
7,643
Perhaps I misunderstood your questions, which seemed to be concerning whether impulse response import should be the same as RTA analysis. There is a File menu entry to import audio data and audio data files can be dropped on the RTA, either will show the frequency response. Import audio data applies a window to the whole file, the RTA analyses a file in chunks but with averaging should give much the same result. Analysis features which are aimed at impulse responses such as RT60 and waterfalls are not applicable for audio data, but you can view the spectrogram of imported audio data. If you want to look at long sections of audio then something like Audacity would be a better tool.
 

sm52

Member
Joined
Mar 14, 2019
Messages
935
should give much the same result
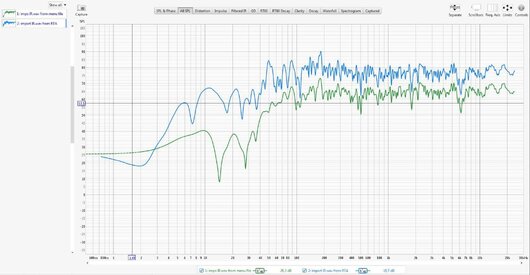
I didn't succeed. The screenshot of post 356 shows that from 150 hertz and below, the import results differ. Also, different levels. Which one is true if you don’t know it in advance? Valid is green. It is obtained through IR import. Why is blue 15 dB higher? Because there are too many averagings? What RTA window settings should I apply so that both import results are almost similar?
 

John Mulcahy

REW Author
Thread Starter
Joined
Apr 3, 2017
Messages
7,643
Are you talking about import impulse response or import audio data? Those are not the same thing, segments of audio data are not impulse responses. Levels in a spectrum depend on the FFT length, if you divide the signal into narrower bands the energy in each band is less.
 

sm52

Member
Joined
Mar 14, 2019
Messages
935
Levels in a spectrum depend on the FFT length
Yes. I saw it. To get almost identical graphs, I opened the wav with IR in the RTA window twice, with an FFT length of 64k and 128k, and applied a dB average to them. Then the levels coincided. But in the low-frequency part, differences remained in the form of graphs. I got what I wanted. Almost. Thank you. Also, if you press info for these two wav files opened in the RTA window, the excitation line says 65536 and 131072 instead of 64k and 128k.
Are you talking about import impulse response or import audio data?
I compared importing IR from a wav file, which results in a frequency response graph (with phase), with opening the same wav file in the RTA window and subsequent processing to obtain a frequency response graph (without phase).
 
Top Bottom