i mean,I don't understand that question.
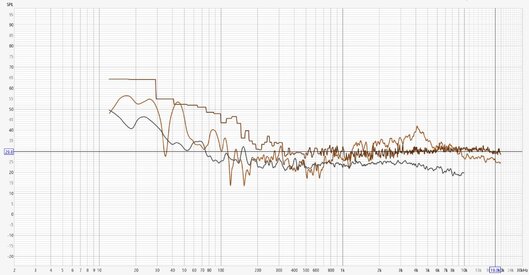
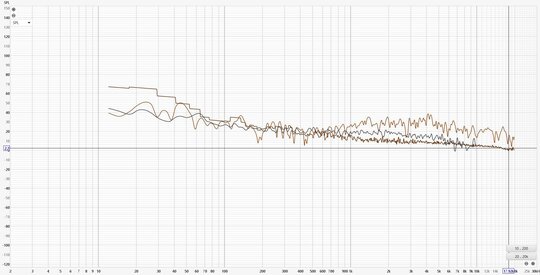
FDW and MTW results are log spaced at 96 PPO and so have inherent smoothing of 1/48 octave.
In the current beta version, to apply something to number one, or to check it out, use Alt + keyboard numbers or arrows (It's not in the current capture, but in the capture, my mouse has already clicked number 1.)
You have to assign this to the graph that I'm trying to see.
But I used to use the old version at those times, because there are a lot of times when you just replace measurements with a mouse without a keyboard. (Old versions can be activated and viewed by simply clicking on it. I understand that the current beta version has that graph turned on like a toggle when you click on it, it's turned off, and you just have to use a keyboard.)
It also doesn't matter with a few measurements, but it takes some time to find and activate each one on the keyboard when it's over 20. (Of course, you can create a group, but it feels like there's too much pre-prep action compared to the previous version where you could see and activate the desired graph with a single mouse click and apply IR windows or something like that.)


