Matthew J Poes
AV Addict
- Joined
- Oct 18, 2017
- Posts
- 1,905
Here are how I deduced what I deduced from your system.

This is a group delay comparison. Not the best way to do this, but I compared it with the excess group delay plots and the overall trends are the same, and this allows me to overlay the graphs to make a point. Yours is the red graph, an ideal full range speaker is the purple, and green is one of my systems. As you can see, if there are subwoofers there is always some group delay compared to a full range speakers, same with the addition of EQ. I have plenty of EQ and crossover filters in my system as well, so you can see that whatever you have done is applying a lot more filtering and thus a lot more group delay.

Here is the TS or peak of the impulse at a given frequency. I noticed that your system had this peak in the TS graph. It suggests a lot of extra delay and it matches the group delay plot. I would look into what is causing that. It's probably a lot of boost near the crossover frequency. It could also be the crossover filter. Sometimes linear phase filters of very high order have very high group delay and I could see it causing a peak. If so, my suggestion is this, sometimes high order linear phase filters aren't a good thing.
Here is an example of some wavelets. You can see how useful these can be for analyzing a system. I wasn't a huge fan of these until someone on this forum suggested I use them. The reason I don't like them is that with a minimum phase system behaving as it should you typically can learn everything you need to know from the steady-state response. Nothing shows up in an FFT plot such as a waterfall or FFT spectrogram that isn't already contained within the steady-state at low frequencies. However, I have found that other interesting things show up in the wavelet that I wouldn't see any other way and I find that useful.

This is that full range speaker I mentioned. It's from a clients room and he has a low false acoustic ceiling. He has very few modal problems and as you can see his wavelet forms a near perfect christmas tree shape. Very few ridges and the peak line has a relatively smooth transition to that dogleg shape I mentioned. Ideally there would be less ridges and no holes in the direct response, but otherwise this is really good.

Here is an example from a system I measured that just had a few little issues. I just needed to make some adjustments to the DSP to get the graph looking a little smoother. The overall delay is a little high but not terrible, the goal, as mentioned, would ideally be to smooth that transition a bit. My guess is that most people's systems probably looks something like this.

This is your wavelet. As you can see, it is more similar to the one above than the first, but...it shows a huge amount of delay in the timing of the peak at LF's. This is what was concerning to me.
I hope that helps.
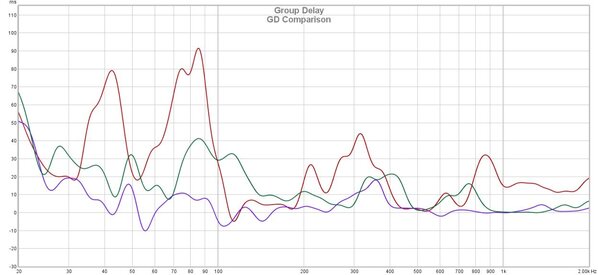
This is a group delay comparison. Not the best way to do this, but I compared it with the excess group delay plots and the overall trends are the same, and this allows me to overlay the graphs to make a point. Yours is the red graph, an ideal full range speaker is the purple, and green is one of my systems. As you can see, if there are subwoofers there is always some group delay compared to a full range speakers, same with the addition of EQ. I have plenty of EQ and crossover filters in my system as well, so you can see that whatever you have done is applying a lot more filtering and thus a lot more group delay.
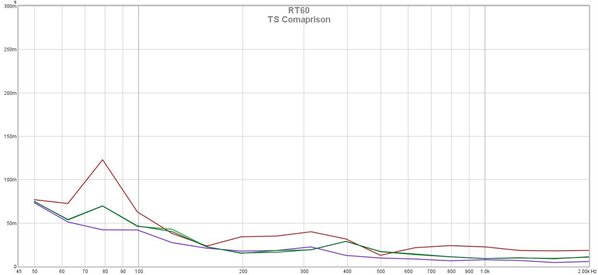
Here is the TS or peak of the impulse at a given frequency. I noticed that your system had this peak in the TS graph. It suggests a lot of extra delay and it matches the group delay plot. I would look into what is causing that. It's probably a lot of boost near the crossover frequency. It could also be the crossover filter. Sometimes linear phase filters of very high order have very high group delay and I could see it causing a peak. If so, my suggestion is this, sometimes high order linear phase filters aren't a good thing.
Here is an example of some wavelets. You can see how useful these can be for analyzing a system. I wasn't a huge fan of these until someone on this forum suggested I use them. The reason I don't like them is that with a minimum phase system behaving as it should you typically can learn everything you need to know from the steady-state response. Nothing shows up in an FFT plot such as a waterfall or FFT spectrogram that isn't already contained within the steady-state at low frequencies. However, I have found that other interesting things show up in the wavelet that I wouldn't see any other way and I find that useful.
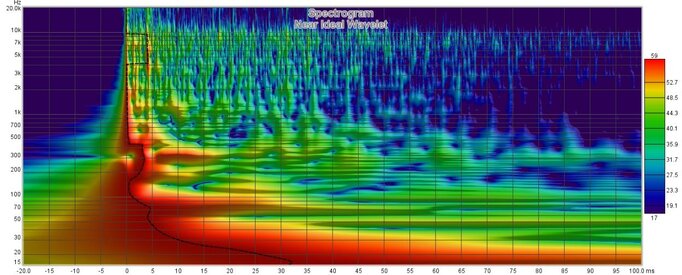
This is that full range speaker I mentioned. It's from a clients room and he has a low false acoustic ceiling. He has very few modal problems and as you can see his wavelet forms a near perfect christmas tree shape. Very few ridges and the peak line has a relatively smooth transition to that dogleg shape I mentioned. Ideally there would be less ridges and no holes in the direct response, but otherwise this is really good.
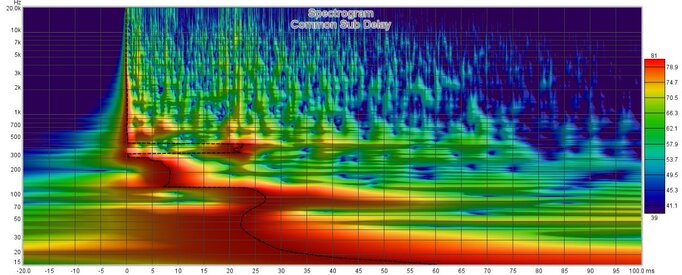
Here is an example from a system I measured that just had a few little issues. I just needed to make some adjustments to the DSP to get the graph looking a little smoother. The overall delay is a little high but not terrible, the goal, as mentioned, would ideally be to smooth that transition a bit. My guess is that most people's systems probably looks something like this.
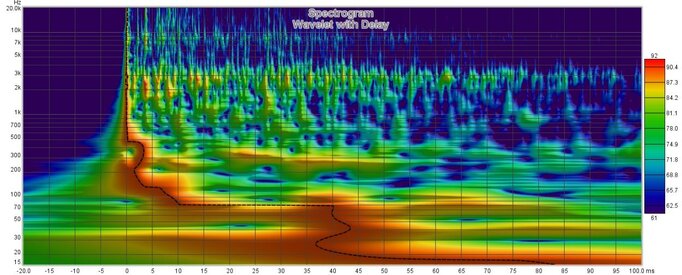
This is your wavelet. As you can see, it is more similar to the one above than the first, but...it shows a huge amount of delay in the timing of the peak at LF's. This is what was concerning to me.
I hope that helps.


