John, for FSAF data, I am seeing the dBFS level remain unchaned for SPL offsets which is great, however adjusting an SPL offset is not adjusting the SPL data in the distortion tab.Builds updated today (beta 72) with these changes:
- Changed: Adding an SPL offset to an FSAF measurement will offset the distortion SPL data
- Changed: Removing a measurement preserves the expanded state of measurement groups
- Fixed: Adding an SPL offset to an FSAF measurement shifted the distortion dBFS data
- Fixed: Generating minimum phase for imported magn and phase data could shift the SPL data


-
AUDIO VIDEO PROCESSING, SETUP & ENVIRONMENTOfficial REW (Room EQ Wizard) Support Forum Audiolense User Forum Calibration Equipment Auto-EQ Platforms / Immersive Audio Codecs Video Display Technologies / Calibration AV System Setup and Support Listening Room / Home Theater Build Projects Room Acoustics and Treatments AV Showcase Movies / Music / TV / Streaming
-
AUDIO VIDEO DISCUSSION / EQUIPMENTHome Theater / Audio and Video - Misc Topics Essence For Hi Res Audio AV Equipment Advice and Pricing Awesome Deals and Budget AV Equipment AV Receivers / Processors / Amps UHD / Blu-ray / CD Players / Streaming Devices Two Channel Hi-Fi Equipment DIY Audio Projects Computer Systems - HTPC / Gaming HD and UHD Flat Screen Displays Projectors and Projection Screens AV Accessories Buy - Sell - Trade
Navigation
Install the app
How to install the app on iOS
Follow along with the video below to see how to install our site as a web app on your home screen.
Note: This feature may not be available in some browsers.
More options
You are using an out of date browser. It may not display this or other websites correctly.
You should upgrade or use an alternative browser.
You should upgrade or use an alternative browser.
REW Beta Release REW API beta releases
- Thread starter John Mulcahy
- Start date

John Mulcahy
REW Author
Thread Starter
- Joined
- Apr 3, 2017
- Posts
- 9,254
All SPL (and other overlay tabs) allow multiple selections, so drag and drop is not as straightforward. It becomes easy if you first select the measurement(s) that you want to move, release the mouse, then click on one of the selected measurements for the drag. Alternatively make the selections, use Ctrl+X to cut them, click where you want them and use Ctrl+V to paste.I agree, the drag and drop to re-order measurements is very awkward on the "ALL SPL" tab, I would prefer that it operates the same elsewhere.
John Mulcahy
REW Author
Thread Starter
- Joined
- Apr 3, 2017
- Posts
- 9,254
Are you using the "Add to data" button?John, for FSAF data, I am seeing the dBFS level remain unchaned for SPL offsets which is great, however adjusting an SPL offset is not adjusting the SPL data in the distortion tab.
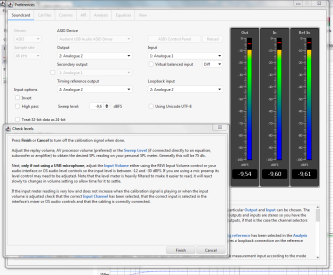
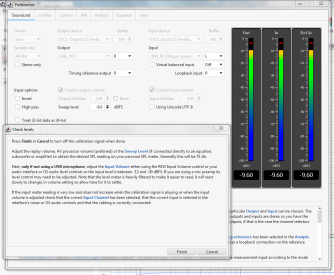
John, hello. If I press the sound card(Audient) levels check button in the Preferences/Soundcard tab, when there is a loop from the output to the input, ASIO drivers is selected and the level I set to -9.6 dB, the indicator shows -9.54 dB at the output. When I switch the selection to Java drivers, the indicator shows -9.6 dB.
Now I want to do a sound card calibration. On ASIO drivers. When the level indicators appear after a few clicks of the Next button, I see -9.6 dB at the output. I'm guessing that Java drivers turned on to calibrate the sound card. Because only for them the indicators showed -9.6 dB. But I need a calibration with ASIO drivers, for which the indicators showed -9.54 dB.
Now I want to do a sound card calibration. On ASIO drivers. When the level indicators appear after a few clicks of the Next button, I see -9.6 dB at the output. I'm guessing that Java drivers turned on to calibrate the sound card. Because only for them the indicators showed -9.6 dB. But I need a calibration with ASIO drivers, for which the indicators showed -9.54 dB.
Attachments
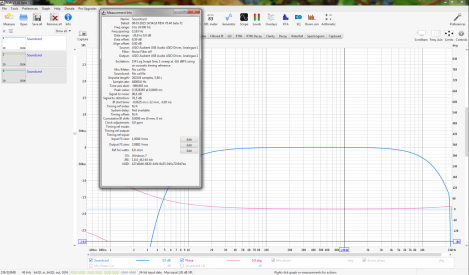
Yet. The calibration of the sound card was done in some way with acoustic synchronization. This is the setting of my last acoustic measurements.
Previously, the length was 256 during the calibration of the sound card. Now 1M. According to my observations, the least noise is at 512 and 2 passes.
Previously, the length was 256 during the calibration of the sound card. Now 1M. According to my observations, the least noise is at 512 and 2 passes.
Attachments
John Mulcahy
REW Author
Thread Starter
- Joined
- Apr 3, 2017
- Posts
- 9,254
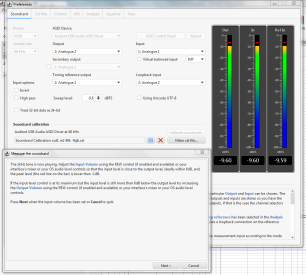
The chosen driver is used for all audio input and output, it is not changed for soundcard calibration. Soundcard calibration uses a sweep that is long enough to provide accurate calibration data at the chosen minimum graph frequency. Soundcard calibration does not use a timing reference.
achugh
Member
More
- Preamp, Processor or Receiver
- Pioneer Elite VSX-LX805
- Universal / Blu-ray / CD Player
- Panasonic BP-UB9000P1K
- Front Speakers
- Klipsch RF7 II
- Center Channel Speaker
- Klipsch RC64 II
- Surround Speakers
- Klipsch RB81 II
- Surround Back Speakers
- KlipschRB81 II
- Subwoofers
- Tweak City Audio CS18.2 (Dual Subs)
- Video Display Device
- LG OLED83G4PUA
- Other Equipment
- Dirac Live Bass Control with UMIK-1 for Pioneer Elite VSX-LX805
- Secondary/Additional Room System
- LG OLED77G2PUA, LG UBK90 Blu-ray, Sonos Arc Ultra, Sonos Sub Gen 4
Hi @John Mulcahy can you please add more details to "if you first select the measurement(s)" statement? In the ALL SPL tab, is there any visual indication if a measurement(s) is selected? All I see is either WHITE or GREY background. Is it possible to visually show if measurement(s) are selected better and ready for dragging?All SPL (and other overlay tabs) allow multiple selections, so drag and drop is not as straightforward. It becomes easy if you first select the measurement(s) that you want to move, release the mouse, then click on one of the selected measurements for the drag. Alternatively make the selections, use Ctrl+X to cut them, click where you want them and use Ctrl+V to paste.
John Mulcahy
REW Author
Thread Starter
- Joined
- Apr 3, 2017
- Posts
- 9,254
Selected measurements have a white background and their names appear in the graph legend and their data appears on the graph.
The complication with the overlay graphs, like All SPL, is that a click and drag that starts on an unselected entry is interpreted by the component as a range selection gesture. Click and drag on one of the selected entries to drag all the selected entries.
The complication with the overlay graphs, like All SPL, is that a click and drag that starts on an unselected entry is interpreted by the component as a range selection gesture. Click and drag on one of the selected entries to drag all the selected entries.
Fine. Why has the output level changed when I turned on the sound card calibration?The chosen driver is used for all audio input and output, it is not changed for soundcard calibration.
Thank you.Soundcard calibration uses a sweep that is long enough to provide accurate calibration data at the chosen minimum graph frequency.
I assumed so too. But the measurement information contains an indication of synchronization.Soundcard calibration does not use a timing reference
John Mulcahy
REW Author
Thread Starter
- Joined
- Apr 3, 2017
- Posts
- 9,254
No idea.Why has the output level changed when I turned on the sound card calibration?
The excitation comment is wrong.the measurement information contains an indication of synchronization
achugh
Member
More
- Preamp, Processor or Receiver
- Pioneer Elite VSX-LX805
- Universal / Blu-ray / CD Player
- Panasonic BP-UB9000P1K
- Front Speakers
- Klipsch RF7 II
- Center Channel Speaker
- Klipsch RC64 II
- Surround Speakers
- Klipsch RB81 II
- Surround Back Speakers
- KlipschRB81 II
- Subwoofers
- Tweak City Audio CS18.2 (Dual Subs)
- Video Display Device
- LG OLED83G4PUA
- Other Equipment
- Dirac Live Bass Control with UMIK-1 for Pioneer Elite VSX-LX805
- Secondary/Additional Room System
- LG OLED77G2PUA, LG UBK90 Blu-ray, Sonos Arc Ultra, Sonos Sub Gen 4
Thank you John for clarifying what constitutes as selected measurement(s). I understand why I am not able to rearrange among the WHITE background measurements. I have to first make the measurements I do not want to move into a GREY background.Selected measurements have a white background and their names appear in the graph legend and their data appears on the graph.
The complication with the overlay graphs, like All SPL, is that a click and drag that starts on an unselected entry is interpreted by the component as a range selection gesture. Click and drag on one of the selected entries to drag all the selected entries.
Once you have good bit of measurements, if the sequence gets messed up, it gets really hard to reorder 1 or 2 measurements. Maybe you can think of some way to make it simply like a preference to disable multi-select measurement for movement/drag-n-drop. Moving individual measurement is required more frequently over moving a group of them; I think.
John Mulcahy
REW Author
Thread Starter
- Joined
- Apr 3, 2017
- Posts
- 9,254
I have made a change for the next build so that an individual selected measurement on an overlay graph (including All SPL) can be moved to a new position by left click and hold on it until a move cursor appears.
John Mulcahy
REW Author
Thread Starter
- Joined
- Apr 3, 2017
- Posts
- 9,254
That's more complicated than it might seem, since there are a lot of absolute SPL dependencies in the waterfall plotting, so that's a no.Small ask, can the normalized waterfall plot change the y-axis scale to dBr, so 0dB is always at the normalized peak level?
Ok, no problem. Main issue that it would address is that the normalized SPL may be quite different between two measurements, so I have to adjust SPL levels to match peak SPL in order to get a matching waterfall plot for each. It's not a big deal, but is a few extra steps.
I measured the voltage at the output of the sound card with a multimeter in both cases. It is the same, in both cases it corresponds to -9.6 dB.ASIO drivers is selected and the level I set to -9.6 dB, the indicator shows -9.54 dB at the output. When I switch the selection to Java drivers, the indicator shows -9.6 dB.
John Mulcahy
REW Author
Thread Starter
- Joined
- Apr 3, 2017
- Posts
- 9,254
Builds updated today (beta 73) with these changes:
- Added: When making FSAF measurements the Measure dialog level control shows the signal peak level
- Added: Action to make response copies of all selected measurements
- Added: An individual selected measurement on an overlay graph (including All SPL) can be moved to a new position by left click and hold on it until a move cursor appears
- Added: measure/filtered-spl-filter-source-uuid endpoint to specify a filtered SPL source measurement by its UUID
- Changed: The STI noise levels default to the absolute speech perception thresholds per IEC 60268-16 A.4.3
- Changed: The roomsim API subsDelayms option will return the Subs delay spinner value even when "Subs have same delay" is false (previously it returned zero)
- Changed: The roomsim API crossoverFrequencyHz option will return the Crossover filter spinner value even when the crossover filter is not selected
- Fixed: Soundcard cal measurement could incorrectly show a timing reference in the measurement info
- Fixed: The d&b tuning filters equaliser entry used classic Q definition, should be symmetric Q definition


Thank you for implementing my feedback right away.
Previously, if there were 9 responses, we had to click Response Copy 9 times. But now, with just a single click, we can instantly duplicate 18, 36, or even over 100 responses.
@John Mulcahy Thanks.
I have another feature request, though I’m not sure if this is possible.

For example, let’s assume that such an EQ has already been created in Measurement 1.

And then, by clicking something like this, you can copy the EQ from the currently active measurement.
(Of course, you can go into the EQ tab, save the preset, and apply it to another measurement—but this would be a simpler way.)
And then, when you click on Measurement 2 and select Paste EQ, it will be instantly applied in the EQ tab.
For example, let’s assume that such an EQ has already been created in Measurement 1.
And then, by clicking something like this, you can copy the EQ from the currently active measurement.
(Of course, you can go into the EQ tab, save the preset, and apply it to another measurement—but this would be a simpler way.)
And then, when you click on Measurement 2 and select Paste EQ, it will be instantly applied in the EQ tab.
<Another Feature Requset>

The current MTW is not in decimal units but rather in whole numbers like 1, 2, 3, 4, and 5.
However, when I manually type "1.3," it is displayed as "1," but I noticed that the graph reflects "1.3."
Could I request it to allow only one decimal place, similar to this?
The current MTW is not in decimal units but rather in whole numbers like 1, 2, 3, 4, and 5.
However, when I manually type "1.3," it is displayed as "1," but I noticed that the graph reflects "1.3."
Could I request it to allow only one decimal place, similar to this?
John Mulcahy
REW Author
Thread Starter
- Joined
- Apr 3, 2017
- Posts
- 9,254
To copy filters right click on the Overlays - Predicted SPL graph.I have another feature request, though I’m not sure if this is possible.
John Mulcahy
REW Author
Thread Starter
- Joined
- Apr 3, 2017
- Posts
- 9,254
It already shows 1 decimal place for me, and always has. Whole numbers of ms won't show a decimal when the window is first shown.The current MTW is not in decimal units but rather in whole numbers like 1, 2, 3, 4, and 5.
However, when I manually type "1.3," it is displayed as "1," but I noticed that the graph reflects "1.3."
John Mulcahy
REW Author
Thread Starter
- Joined
- Apr 3, 2017
- Posts
- 9,254
Meaning you want two decimal places? I can't see the point of that.Oh my mistake. Sorry. i mean 0.25 , 1.55 like this
I could add it, but the reason it only appears on Predicted SPL is that's the only place the action will have a visible effect on the traces.Yes, is there a way to use this directly in the ALL SPL section instead of as an overlay? That’s what I’m requesting.
Hmm... I see what you mean.I could add it, but the reason it only appears on Predicted SPL is that's the only place the action will have a visible effect on the traces.
In that case, how about allowing the "Copy from" option to be accessed the same way when right-clicking on the graph inside the EQ tab of each measurement, instead of just in Predicted SPL?
For example, right now, if I create a specific EQ for Measurement 1, I have to save it as an EQ preset, then go to Measurement 2, load the preset, and apply it manually.
Meaning you want two decimal places? I can't see the point of that.

In the IR window, values like 0.25 are displayed with two decimal places, but I found it a bit odd that MTW doesn’t show them.
(Currently, even in MTW, if you enter 0.25 and press Enter, it changes to 0.2, but it actually applies as 0.25.)


Popular tags
20th century fox
4k blu-ray
4k uhd
4k ultrahd
action
adventure
animated
animation
bass
blu-ray
calibration
comedy
comics
denon
dirac
dirac live
disney
dolby atmos
drama
fantasy
hdmi 2.1
home theater
horror
kaleidescape
klipsch
lionsgate
marantz
movies
onkyo
paramount
pioneer
rew
romance
sci-fi
scream factory
shout factory
sony
stormaudio
subwoofer
svs
terror
thriller
uhd
ultrahd
ultrahd 4k
universal
value electronics
warner
warner brothers
well go usa